 KSOEM
KSOEM

Articles
- Page Path
- HOME > Ann Occup Environ Med > Volume 38; 2026 > Article
- Original Article Occupational determinants of national health screening participation: an analysis of the Korea National Health and Nutrition Examination Survey (KNHANES), 2007–2023
-
Chan Young Lee
 , Jun-Pyo Myong, Mo-Yeol Kang*
 -
Annals of Occupational and Environmental Medicine 2026;38:e22.
DOI: https://doi.org/10.35371/aoem.2026.38.e22
Published online: June 24, 2026
Department of Occupational and Environmental Medicine, Seoul St. Mary’s Hospital, College of Medicine, The Catholic University of Korea, Seoul, Korea
- *Corresponding author: Mo-Yeol Kang Department of Occupational and Environmental Medicine, Seoul St. Mary’s Hospital, College of Medicine, The Catholic University of Korea, 222 Banpo-daero, Seocho-gu, Seoul 06591, Korea E-mail: snaptoon@naver.com
• Received: March 16, 2026 • Revised: June 16, 2026 • Accepted: June 16, 2026
© 2026 Korean Society of Occupational & Environmental Medicine
This is an Open Access article distributed under the terms of the Creative Commons Attribution Non-Commercial License (https://creativecommons.org/licenses/by-nc/4.0/) which permits unrestricted non-commercial use, distribution, and reproduction in any medium, provided the original work is properly cited.
- 873 Views
- 28 Download


Abstract
-
Background South Korea operates a national health screening program aimed at early detection of major diseases. Although participation rates have been linked to various socioeconomic and demographic factors, occupational determinants remain insufficiently characterized.
-
Methods This study analyzed 37,987 employed wage earners from the Korea National Health and Nutrition Examination Survey conducted between 2007 and 2023. The primary outcome was self-reported health screening program participation within the preceding two years. Occupational characteristics—including classification of occupations, employment status, working hours, work arrangement, and supervisory role—as well as workplace conditions and hazard exposures were examined. Prevalence ratios (PRs) with 95% confidence intervals were calculated for each characteristic. Generalized additive models were used to examine the nonlinear association between weekly working hours and participation rates. Multivariable modified Poisson regression models incorporating interaction terms between occupational characteristics and survey year assessed temporal trends in participation disparities.
-
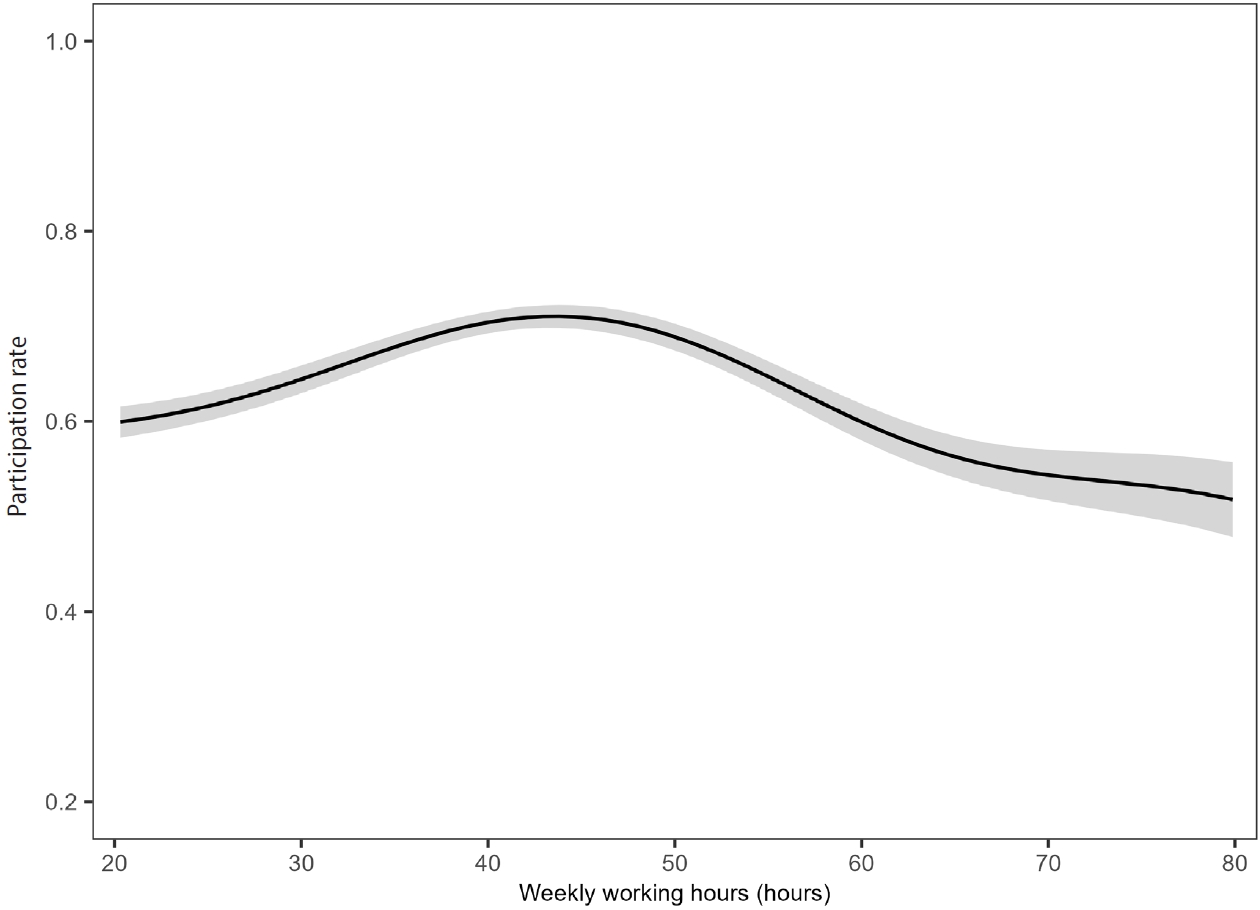
Results The overall health examination rate was 71.32%. Compared with managers, all other occupational categories—except armed forces—had significantly lower PRs of participation, with sales workers showing the lowest. Temporary, daily, non-regular, and part-time workers showed significantly lower PRs. Those working less than 35 or more than 52 hours per week showed significantly lower PRs than the reference group (35–52 hours). An inverted U-shaped association was observed, with participation peaking at approximately 40–50 hours per week. Among workplace conditions, decision-making authority, working under time pressure, and physical hazard exposure were associated with higher participation, whereas prolonged uncomfortable postures and heavy material handling were associated with lower participation. Over the 17-year study period, the adjusted PRs for working hours showed no significant temporal change.
-
Conclusions Significant occupational disparities in health screening participation exist among Korean wage earners. Targeted interventions addressing vulnerable occupational groups are warranted to reduce disparities and improve overall worker health outcomes.
BACKGROUND
In South Korea, a national health screening program operates as a systematic approach to improving public health outcomes through early detection and prevention. The program is designed to identify major causes of mortality, particularly cancer and cardiovascular diseases, during asymptomatic stages to facilitate timely treatment or lifestyle modifications that enhance the quality of life.1 Previous studies have shown significant associations between national health screening services and reduced rates of serious atherosclerotic cardiovascular disease events and overall mortality in the general population.2,3
Participation in screening may lead to behavioral changes and subsequent medical interventions, such as pharmacological treatment, which can ultimately result in clinical benefits. Accordingly, the South Korean government has implemented various strategies to increase screening participation rates, including public awareness campaigns, financial support for screening costs, expansion of medical facilities, and mandatory workplace screening programs.4 Despite these comprehensive efforts, participation rates remain uneven across different population segments.5
Several studies have identified multiple factors that influence screening participation rates. These factors encompass demographic characteristics such as sex and age; socioeconomic indicators including education level and income; geographical factors such as regional hospital availability; and personal circumstances including marital status and health insurance type.6-10
Several occupational characteristics have been examined in previous studies. Regular employment status was associated with higher participation rates than irregular employment.8 Office workers consistently showed higher screening rates than non-office workers.7 Additionally, daytime and rotating-shift workers exhibited higher participation rates than night-shift workers.8
However, previous studies have typically focused on limited subsets of occupational variables or have incorporated these factors within broader demographic and sociological analyses, rather than focusing on occupational factor research. Furthermore, existing studies have predominantly employed single-year cross-sectional data, limiting our understanding of temporal patterns of disparities in screening participation across different occupational groups.
Therefore, this study aimed to determine whether the various occupational factors included in the Korea National Health and Nutrition Examination Survey (KNHANES) created significant disparities in health screening participation rates and to examine how these disparities have changed over time. This analysis aims to provide foundational evidence for the development of effective promotion and support strategies targeting population groups with low screening participation rates.
METHODS
This study used data from the KNHANES conducted by the Korea Disease Control and Prevention Agency from 2007 to 2023. The KNHANES is a series of annual cross-sectional survey designed to provide health assessment data for the Korean national population. This annual survey employed a complex stratified sampling design to ensure representativeness of the target population.11
The target population consisted of participants identified as employed wage earners. Employed wage earners were defined as participants meeting the following criteria: the first criterion required a “Yes” response to the question “Have you worked for income purposes for one hour or more, or worked as an unpaid family worker for 18 hours or more during the past week? This includes cases where you normally work but are temporarily on leave.” The second criterion required the answer “employed by others or a company and receiving compensation (wage earner)” to the question “Which of the following categories best describes your work?” The sample size and selection flow are shown in Fig. 1.
The dependent variable in this study was health examination participation, which was determined by responses to the question, “Have you received a health examination within the past two years?” in the KNHANES data.
Occupational characteristics were established as independent variables in this study. The KNHANES data include occupational characteristics such as employment status, economic activity status, occupational classification, and working hours, although the specific variables collected varied by survey year. ‘Occupations’ were classified based on the major categories of the Korean Standard Classification of Occupations (KSCO). The 6th revision of the KSCO was applied from 2007 to 2017, while the 7th revision was applied from 2018 to 2023. Despite these revisions, the ten major occupation categories utilized in this study remained consistent throughout the survey period; managers, professionals, clerks, service workers, sales workers, skilled agricultural/forestry and fishery workers, craft and related trades workers, plant and machine operators and assemblers, elementary occupations, and armed forces. ‘Employment status’ was categorized into regular worker, temporary worker, or daily worker based on the question, “Which of the following best describes your employment status at your workplace?” Separately, ‘Regular employment’ was assessed with the question, “Is your current job (workplace) a regular or non-regular position?” ‘Dispatched or contracted work’ status was determined based on whether wages were received directly from the workplace or through affiliated dispatching or contracting companies. The measurement of working hours in the KNHANES varied over time. From 2007 to 2009, data were collected separately for full-time and part-time work, whereas from 2010 onwards, they were collected as average weekly working hours. To ensure consistency across all survey years, we calculated the average weekly working hours for the 2007–2009 period by combining full-time and part-time working hours. This continuous variable was then categorized into three groups: <35 hours per week (short working hours), 35–52 hours per week (standard working hours), and >52 hours per week (long working hours, exceeding the threshold defined by the Korean Labor Standards Act as the 40-hour standard work week plus 12 hours of overtime). The standard working hours group (35–52 hours/week) served as the reference category for the analyses. ‘Work arrangement’ was collected through the question “What type of working hours do you have?” with responses categorized as full- or part-time. ‘Work schedules’ were collected based on whether participants worked primarily during daytime hours: “Mainly works during daytime” and “Also works during other hours.”
Several occupational characteristics were collected using “Yes” or “No” response formats. ‘Supervisory position’ indicates whether workers hold supervisory responsibilities over other employees. ‘Contingent work’ indicates whether income is earned based on output. ‘Work from home’ inquired about whether work was performed at home, neighbors’ homes, or nearby residences. Additionally, workplace conditions and demands were collected using response scales of either “Not at all, No, Yes, Very much” or “Not exposed, exposed but not a serious problem, exposed and seriously problematic” to assess the degree of perceived exposure or severity.
Since this study determined health examination participation based on examinations conducted over 2 years, characteristics related to the longest-held job were not included. Workplace size was excluded because it was collected in the KNHANES specifically for self-employed individuals and employers rather than wage earners. Sex and age were included as covariates to adjust for potential confounding effects. For the analysis, age was categorized into three groups: 20s–30s, 40s–50s, and 60s or above.
The number of participants and health examination participation rates were calculated for each demographic and occupational characteristic across all the survey years. Reference groups were established for each characteristic. For characteristics with binary categories (“Yes” or “No”), the “No” category was established as the reference group. For variables with two or more non-binary categories, the group with the highest health examination rate was used as the reference group. The following variables were exceptions, for which a more appropriate baseline group was used as the reference: managers (the first category of the KSCO major groups) for ‘Classification of occupations’ and the category denoting the absence of the condition or exposure (“Not at all” or “Not exposed”) for workplace conditions and hazard exposures. Prevalence ratios (PRs) with 95% confidence intervals (CIs) were estimated using modified Poisson regression with robust variance estimation. This method was selected over logistic regression because odds ratios can overestimate the relative risk when the outcome is common, as is the case in this study where the overall participation rate exceeded 70%.12
As average weekly working hours were the only continuous occupational variable subject to categorization in our analysis, this nonparametric approach was used to confirm that the categorization of working hours adequately captured the observed dose-response pattern. A generalized additive model (GAM) was additionally constructed to visualize the underlying nonlinear association between average weekly working hours and participation rates in general health screening, adjusting for sex, age, and employment status.
To examine how disparities in health examination rates by each characteristic changed according to the survey year, a multivariable survey-weighted modified Poisson regression analysis was conducted using two models. Both models included sex, age group, employment status, and working hour group, the characteristics assessed without missing values across all survey years. Although ‘Classification of occupation’ had no missing values from 2007 to 2023, it was excluded because several of its 10 categories had small sample sizes. Model 1 incorporated the interaction terms between each characteristic and survey year in the multivariable survey-weighted modified Poisson regression analysis to estimate the PR for each characteristic according to the survey year, along with 95% CIs. The slope coefficient (β) and p-values for the interaction terms of characteristics according to survey year were calculated to determine whether statistically significant changes were observed. Model 2 accounted for the fact that the KNHANES data comprised a series of cross-sectional studies with independent samples for each survey year. Therefore, separate survey-weighted multivariable modified Poisson regression analyses were performed for each survey year dataset to calculate the adjusted PRs according to the survey year.
All analyses were conducted using R version 4.5.1 (R Project for Statistical Computing, Vienna, Austria), with the survey package used for analyzing a complex stratified sampling design. For statistical calculations, a p-value < 0.05 was considered significant.
For this secondary analysis utilizing de-identified data, Institutional Review Board (IRB) approval was waived by the Institutional Review Board of Seoul St. Mary’s Hospital (approval No. KC26ZISI0117). The KNHANES was approved by the IRB of the Korea Disease Control and Prevention Agency (IRB: 2007-02CON-04-P, 2009-01CON-03-2C, 2008-04EXP-01-C, 2010-02CON-21-C, 2011-02CON-06-C, 2012-01EXP-01-2C, 2013-12EXP-035C, 2018-01-03-P-A, 2018-01-03-C-A, 2018-01-03-2C-A, 2018-01-03-5C-A, 2018-01-03-5C-A, 2022-11-16-R-A). Informed consent was submitted by all participants when they were enrolled.
RESULTS
The final analysis included 37,987 wage earners, whose general characteristics are presented in Table 1. The overall health examination rate of the participants was 71.3%. The sample comprised 19,108 men and 18,879 women, with health examination rates of 74.3% and 68.3%, respectively, indicating a higher participation among males. Regarding age groups, participants in their 40s and 50s showed the highest health examination rate at 81.1%, followed by those aged 60 and above (77.6%) and participants in their 20s and 30s (58.1%). Analysis of health examination rates by survey year revealed an overall increasing trend toward more recent survey years, although the 2014 and 2021 survey years showed lower health examination rates than the preceding survey years.
The PRs and rates of health examination participation according to the 10 occupational characteristics are presented in Table 2. Compared with managers (the reference group), all other occupational categories, with the exception of the armed forces, had significantly lower prevalences of health examinations. The PRs ranked from highest to lowest were as follows: armed forces; managers; plant and machine operators and assemblers; clerks; professionals; craft and related trades workers; elementary occupations; service workers; skilled agricultural, forestry, and fishery workers; and sales workers. Temporary and daily workers showed significantly lower PRs than regular workers. Those with non-regular employment status showed significantly lower PRs than those with regular employment status. Part-time workers had lower PRs than full-time workers. Individuals in supervisory positions showed significantly higher PRs, whereas dispatched, contingent, and home-based workers showed significantly lower PRs. Regarding work schedules, employees who also worked other hours showed significantly lower PR than those who worked mainly during daytime hours. When examining the average weekly working hours, both groups working less than 35 hours and more than 52 hours showed significantly lower PRs than the reference group (35–52 hours), with the <35 hours group showing the lowest PR.
GAM analysis was performed to examine the nonlinear relationship between average weekly working hours and health screening participation rates, adjusted for sex, age group, and employment status (Fig. 2). The analysis revealed an inverted U-shaped association, with participation rates peaking at approximately 40–50 hours/week. Deviations from standard working hours in either direction were associated with decreased participation rates.
The 14 workplace conditions and demands and their corresponding health examination rates and PRs are presented in Table 3. “Very much” response for ‘Clean and pleasant work environment’ and a “Yes” or “Very much” response for ‘Risk of accidents’ or ‘Working under time pressure’ were associated with significantly higher PRs. Compared to the “Not at all” reference group, any reported level of ‘Decision-making authority’ was associated with significantly higher PRs. ‘Being respected and trusted’ was not a statistically significant factor for health examinations, while participants who answered “Yes” or “Very much” to ‘Prolonged uncomfortable positions’ exhibited significantly lower PRs. Regarding ‘Heavy material handling’, groups that responded with answers other than “Not at all” (including “No,” “Yes,” and “Very much”) showed significantly lower PRs compared to the reference group. For ‘Emotional labor,’ groups responding “No” or “Yes” showed significantly higher PRs relative to the reference group; however, the group answering “Very much” paradoxically showed lower PRs. Regarding exposure to ‘Hazardous chemical substances’ and ‘Infectious agents,’ groups indicating that exposure was not a serious problem exhibited significantly higher PRs than the reference group, whereas those reporting “Serious problems” showed no significant differences. For those with exposure to ‘Air pollutant,’ there were no significant differences in the health examination PRs for either the non-serious or serious exposure levels. Exposure to ‘Dangerous tools, machines, and equipment’ or to ‘Fire, burns, and electrical shock’ resulted in significantly higher PRs regardless of whether the exposure was considered a serious problem. For ‘Noise’ exposure, the groups reporting non-serious problems showed no significant differences, whereas those identifying noise as a serious problem showed significantly higher PRs.
Multivariable modified Poisson regression analysis, incorporating interaction terms between occupational characteristics and survey year, revealed distinct temporal patterns of disparity across subgroups. Figures presenting the analysis results from model 1 and model 2 analyses for sex, age group, employment status, and working hour group are included in the Supplementary Figs. 1–7.
In model 1, the main effect of survey year was statistically insignificant (β = 0.00, p = 0.94). The interaction between sex and survey year was statistically significant (β = 0.01, p < 0.05). For the age group, the interaction between “20s and 30s” and survey year was statistically significant (β = 0.01, p < 0.05), whereas the interaction between “60s or above” and survey year was not (β = 0.00, p = 0.09). The adjusted PRs for “60s or above” remained above 1 throughout the entire study period, indicating that—after adjustment for sex, employment status, and working hours—this group was more likely to participate in health examinations than the reference age group (“40s and 50s”), which exhibited the highest participation rate. With respect to temporal trends, the PRs for “20s and 30s” showed a statistically significant increasing pattern, whereas the PRs for “60s or above” showed a non-significant decreasing pattern, with age-related disparities also diminishing over the course of the study period. Regarding ‘Employment status’, the interactions between employment status and survey year were statistically significant for both “Temporary workers” (β = 0.02, p < 0.05) and “Daily workers” (β = 0.02, p < 0.05). In contrast, neither the interaction between short working hours (<35 hours/week) and survey year nor the interaction between long working hours (>52 hours/week) and survey year was statistically significant, suggesting no significant change in PRs over the study period (0.00 < β < 0.01, p = 0.98 for short working hours and –0.01 < β < 0.00, p = 0.81 for long working hours).
In model 2, the adjusted PRs for employment status and working hour group according to the survey year each showed temporal trends similar to those in model 1 (Supplementary Table 1).
DISCUSSION
The primary objective of this study was to examine whether employment and workplace conditions measured in the KNHANES are associated with meaningful differences in the rates at which individuals participate in health screening programs, and to assess how these disparities have changed across survey years.
Consistent with previous literature, regular workers showed significantly higher examination participation rates than irregular workers.8 The analysis also revealed that workers with greater job stability consistently showed higher participation rates, with regular workers showing significantly higher participation rates than temporary workers, daily workers, dispatch workers, and part-time employees. Additionally, workers who mainly worked during the daytime showed higher screening rates than those who also worked during other hours, which is consistent with existing research.8 In addition, workers with short working hours (<35 hours/week) showed lower participation rates, which may be attributable to employment instability.13
Furthermore, workers with average weekly working hours exceeding 52 hours had lower participation rates. Previous surveys of national health screening participation rates provided a supporting context for these findings. According to the National Health Insurance Service report on the “Health Screening Participant Satisfaction and Non-participant Awareness Survey” in 2007, the primary reason for non-participation among workplace subscribers was “lack of time and being busy,” accounting for 37.7% of responses.14 The study examined both participation rates and reasons for non-participation, identifying time constraints as the predominant factor for non-participation.15 These findings suggest that the availability of time significantly influences participation behavior. Workers who likely possessed autonomy over schedules such as managers in occupational classifications and supervisory positions showed significantly higher screening rates. Similarly, armed force personnel showed significantly higher screening rates, which can be attributed to the annual health screenings implemented with paid leave provisions in South Korea.16 Conversely, workers in contingent work arrangements, where performance directly affects compensation, showed lower screening rates, likely because of similar time-constraint factors. These results were further supported by a GAM analysis, which revealed an inverted U-shaped association between weekly working hours and participation rates.
Based on the analysis of health examination participation rates according to workplace conditions and hazard exposure, the findings showed that how workers perceive their work environment and the type of demands imposed by their job showed a stronger association with health examination participation behavior. For instance, workers who explicitly recognized physical hazards such as ‘Risk of accidents,’ ‘Dangerous tools, machines, and equipment,’ or ‘Fire, burns, and electrical shock’ exhibited significantly higher health examination rates. These findings can be interpreted from two perspectives. First, these hazardous factors are subject to special health examinations under the Occupational Safety and Health Act, making such screenings legally mandatory.17 Second, as workers become aware of occupational risks, their vigilance regarding potential health problems may heighten, leading to preventive health behaviors.18 Conversely, workers in positions involving significant physical burden, such as ‘Prolonged uncomfortable positions’ or ‘Heavy material handling,’ showed significantly lower examination rates. In contrast to hazards covered by legally mandated special health examinations under the Occupational Safety and Health Act, ‘Prolonged uncomfortable positions’ and ‘Heavy material handling’ fall outside the scope of mandatory occupational screening. This regulatory gap may, in turn, diminish the perceived need for periodic health screening in this group, thereby reducing the vigilance and preventive health behaviors typically promoted by recognized hazard exposures.18
Based on the interaction analysis, although crude participation rates increased across the entire study population from 2007 to 2023, the association of survey year with health examination participation was no longer statistically significant after adjustment for sociodemographic and occupational covariates. This finding indicates that the overall temporal increase in participation was not driven by a uniform rise across the population, but rather by the progressive narrowing of disparities by age, sex, and employment status (Supplementary Figs. 1–5).
Regarding working hours, however, the adjusted PRs for short and long working hours showed no significant changes across survey years (Supplementary Figs. 6 and 7). Unlike the disparities by age, sex, and employment status, which progressively narrowed, those related to working hours persisted, warranting particular attention from an occupational health perspective. Long working hours have been associated with an increased risk of coronary heart disease incidence and mortality,19 and Korean longitudinal evidence shows that workers exposed to >52 hours per week have more than twice the risk of subsequent cardiovascular disease onset.20 Long working hours have additionally been linked to dyslipidemia,21 hypertension,22 diabetes,23,24 and depressive symptoms.25 Short working hours have also been linked to elevated cardiovascular risk and depression mediated by job and income insecurity.25-27 However, our findings show that these high-risk workers are the groups less likely to undergo screening. Taken together, these findings highlight the need for targeted policy interventions to enhance screening participation among workers with short or long working hours—a high-risk group that the current program has not adequately reached.
This study has several notable strengths. In terms of data, this study leveraged 17 years of nationally representative information from the KNHANES (2007–2023), with survey weights and the complex sampling design appropriately applied to ensure generalizability to the Korean wage-earning population. In terms of scope, this study examined a comprehensive set of occupational characteristics—including classification of occupations, employment status, working hours, work arrangement, supervisory role, and workplace conditions. In terms of analysis, the incorporation of interaction terms between occupational characteristics and survey year allowed us to evaluate whether disparities have narrowed, persisted, or widened over time.
Despite these strengths, this study had several limitations. First, a primary limitation is that certain independent variables, collected several years prior due to survey modifications, may no longer accurately reflect contemporary workplace conditions; for example, data on workplace environments and hazard exposures surveyed from 2007 to 2009 may not represent the current status. This discrepancy likely reflects not only the passage of time but also evolving government regulations and shifts in workers’ and employers’ perceptions of occupational hazards during the study period. Second, the potential for unexamined occupational factors to act as confounding variables cannot be excluded, because not all possible occupational factors were included in the survey. For instance, whether employers provided paid leave for health screening—a factor that may directly affect a worker’s opportunity to attend screening—was not assessed. Third, although data from multiple survey years were utilized, this study was cross-sectional rather than a longitudinal cohort study, which limits the ability to establish definitive causal relationships. Fourth, because the data relied on self-reported survey responses, the potential for recall bias must be acknowledged. Fifth, as this research was conducted exclusively within the South Korean context, the findings may have limited generalizability to other countries with different labor market structures or health screening systems. Sixth, individuals with low employment stability may have been excluded from the analysis. Specifically, those who were not employed at the time of the survey may have been omitted based on the exclusion criteria. Finally, the KNHANES data did not distinguish between voluntary health examinations and legally mandated examinations, such as the special health examinations, and this distinction could not be controlled in the analysis.
CONCLUSIONS
This study found that employment and workplace conditions are significantly associated with workers’ participation in health examinations. These findings provide important evidence for the development of targeted policy-level interventions that account for specific occupational factors, which can enhance screening participation rates and contribute to overall improvements in worker health. Further research employing longitudinal designs that track changes in health-risk awareness and distinguish legally mandated special health examinations is warranted to clarify the mechanisms underlying the persistent participation gap observed among workers.
Abbreviations
CI
confidence interval
GAM
generalized additive model
KNHANES
Korea National Health and Nutrition Examination Survey
KSCO
Korean Standard Classification of Occupations
PR
prevalence ratio
-
Competing interests
Mo-Yeol Kang, contributing editor of the Annals of Occupational and Environmental Medicine, was not involved in the editorial evaluation or decision to publish this article. All remaining authors have declared no conflicts of interest.
-
Author contributions
Conceptualization: Lee CY. Data curation: Lee CY. Formal analysis: Lee CY. Validation: Kang MY. Visualization: Lee CY. Writing - original draft: Lee CY. Writing - review & editing: Myong JP, Kang MY.
-
Acknowledgments
The author(s) used Claude Sonnet 4.6 (claude.ai), developed by Anthropic, PBC, in March 2026 for the purpose of English translation of the manuscript. The author(s) take full responsibility for the integrity and accuracy of all content generated with the assistance of this AI tool.
NOTES
SUPPLEMENTARY MATERIAL
Supplementary Table 1.
Year-specific adjusted prevalence ratios relative to reference categories with 95% confidence intervals.
Supplementary Fig. 1.
Trends in adjusted prevalence ratios for health examinations by sex.
Supplementary Fig. 2.
Trends in adjusted prevalence ratios for health examinations by age group (20s and 30s).
Supplementary Fig. 3.
Trends in adjusted prevalence ratios for health examinations by age group (60s or above).
Supplementary Fig. 4.
Trends in adjusted prevalence ratios for health examinations by employment status (temporary workers).
Supplementary Fig. 5.
Trends in adjusted prevalence ratios for health examinations by employment status (daily workers).
Supplementary Fig. 6.
Trends in adjusted prevalence ratios for health examinations by short working hours.
Supplementary Fig. 7.
Trends in adjusted prevalence ratios for health examinations by long working hours.
Fig. 1.
Selection flow of study participants. KNHANES: Korea National Health and Nutrition Examination Survey.
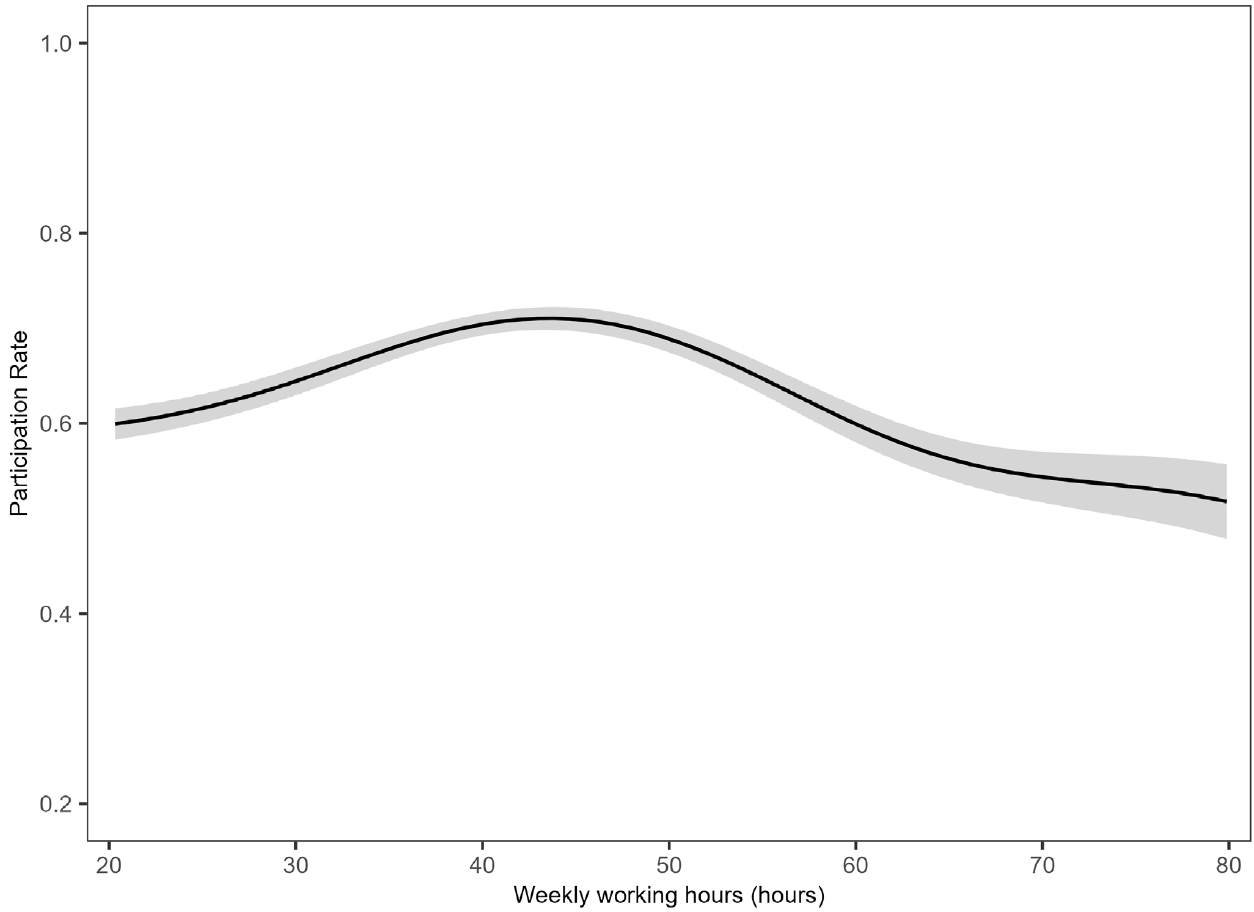
Table 1.
Health examination rates by general characteristics of study participants
Table 2.
Participation rates and prevalence ratios for health examination by occupational characteristics
Table 3.
Participation rates and prevalence ratios for health examination by workplace conditions and hazard exposures
- 1. Ministry of Health and Welfare. 2025 National Health Screening Program Guide. Sejong, Korea: Ministry of Health and Welfare; 2025.
- 2. Suh Y, Lee CJ, Cho DK, Cho YH, Shin DH, Ahn CM, et al. Impact of national health checkup service on hard atherosclerotic cardiovascular disease events and all-cause mortality in the general population. Am J Cardiol 2017;120(10):1804–12.ArticlePubMed
- 3. Eom H, Myong JP, Kim EA, Choi B, Park SW, Kang YJ. Effectiveness of workers’ general health examination in Korea by health examination period and compliance: retrospective cohort study using nationwide data. Ann Occup Environ Med 2017;29:2.ArticlePubMedPMCPDF
- 4. Shin DW, Cho J, Park JH, Cho B. National general health screening program in Korea: history, current status, and future direction: a scoping review. Precis Future Med 2022;6(1):9–31.ArticlePDF
- 5. Kang HT. Current status of the National Health Screening Programs in South Korea. Korean J Fam Med 2022;43(3):168–73.ArticlePubMedPMCPDF
- 6. Occupational Safety and Health Research Institute. A Study on Improvement Plans for General Health Examination Items and Intervals for Workers. Ulsan, Korea: Occupational Safety and Health Research Institute; 2015.
- 7. Moon KS, Kim YK, Chang HJ. Determinants of the use and type of comprehensive medical examination services. Korean J Health Serv Manag 2016;10(2):83–97.Article
- 8. Kim SE, Yoon YS, Yang YJ, Lee ES, Lee JH, Kim DJ, et al. The effect of non-regular employment on the health behaviors, mental health and quality of life: data from the Korea National Health and Nutrition Examination Survey 2013. Korean J Stress Res 2016;24(3):127–36.Article
- 9. Noguchi R, Shen J. Factors affecting participation in health checkups: evidence from Japanese survey data. Health Policy 2019;123(4):360–6.ArticlePubMed
- 10. Yoo AH, Jo SH, Shin HW, Lee SW. Analysis of influencing factors on health examination acceptance rate: focused on the 7th National Health and Nutrition Survey Data. J Ind Converg 2021;19(1):1–6.Article
- 11. Kweon S, Kim Y, Jang MJ, Kim Y, Kim K, Choi S, et al. Data resource profile: the Korea National Health and Nutrition Examination Survey (KNHANES). Int J Epidemiol 2014;43(1):69–77.ArticlePubMedPMC
- 12. Zou G. A modified poisson regression approach to prospective studies with binary data. Am J Epidemiol 2004;159(7):702–6.ArticlePubMedPMC
- 13. International Labour Office. Non-standard Employment around the World: Understanding Challenges, Shaping Prospects - Overview. Geneva, Switzerland: International Labour Organization; 2016.
- 14. Health Insurance Research Institute. Survey on the Satisfaction of Health Check-up Recipients and the Perception of Non-recipients. Seoul, Korea: Health Insurance Research Institute; 2007.
- 15. Occupational Safety and Health Research Institute. A Study on the Actual Condition of Workers’ Health Check-ups. Ulsan, Korea: Occupational Safety and Health Research Institute; 2019.
- 16. Korean Law Information Center. Article 6. Directive on Military Health Promotion. https://www.law.go.kr/LSW/admRulLsInfoP.do?chrClsCd=&admRulSeq=2100000270146. Updated 2026. Accessed May 15, 2026.
- 17. Korea Legislation Research Institute. Article 130. Occupational Safety and Health Act. https://elaw.klri.re.kr/kor_service/lawView.do?hseq=70920&lang=ENG. Updated 2025. Accessed May 15, 2026.
- 18. Sorensen G, Stoddard A, Hammond SK, Hebert JR, Avrunin JS, Ockene JK. Double jeopardy: workplace hazards and behavioral risks for craftspersons and laborers. Am J Health Promot 1996;10(5):355–63.ArticlePubMedPDF
- 19. Jeon SY, Lee CY, Lee YH, Kim H, Kim J, Cho SK, et al. Occupational risk factors for cardiovascular disease: a comprehensive review. Curr Cardiol Rep 2025;27(1):143.ArticlePubMedPDF
- 20. Kim S, Jung Y. Effect of long working hours on cardiovascular disease in South Korean workers: a longitudinal study. Asia Pac J Public Health 2021;33(2-3):213–9.ArticlePubMedPDF
- 21. Lee CY, Jeon SY, Ahn J, Song JH, Kang MY. Long working hours and dyslipidemia: a systematic review and meta-analysis. Saf Health Work 2025;16(3):268–80.ArticlePubMedPMC
- 22. Yoo DH, Kang MY, Paek D, Min B, Cho SI. Effect of long working hours on self-reported hypertension among middle-aged and older wage workers. Ann Occup Environ Med 2014;26:25.ArticlePubMedPMCPDF
- 23. Keller E, Chen L, Gao F, Li J. Risk for diabetes from long working hours and night work in the United States: prospective associations and machine learning techniques. Saf Health Work 2025;16(3):355–60.ArticlePubMedPMC
- 24. Seo E, Lee Y, Mun E, Kim DH, Jeong Y, Lee J, et al. The effect of long working hours on developing type 2 diabetes in adults with prediabetes: the Kangbuk Samsung Cohort Study. Ann Occup Environ Med 2022;34:e4.ArticlePubMedPMCPDF
- 25. Harma M, Kecklund G, Tucker P. Working hours and health: key research topics in the past and future. Scand J Work Environ Health 2024;50(4):233–43.ArticlePubMedPMC
- 26. Jeong I, Rhie J, Kim I, Ryu I, Jung PK, Park YS, et al. Working hours and cardiovascular disease in Korean workers: a case-control study. J Occup Health 2014;55(5):385–91.ArticlePubMedPDF
- 27. Nielsen HB, Kirchheiner-Rasmussen J, Dyreborg J, Larsen AD, Madsen IE, Pedersen J, et al. Trajectories of marginal part-time work and risk of depression. Does job or income insecurity mediate the relation? Scand J Work Environ Health 2023;49(4):271–82.ArticlePubMedPMC
REFERENCES
Figure & Data
REFERENCES
Citations
Citations to this article as recorded by 
 Cite
Cite XML Download
- Figure
-
- Related articles
-
- Occupational differences in benzene-related biomarker levels beyond traditional industrial settings: findings from the Korean National Environmental Health Survey, 2015–2023
- Association between heavy metal exposure and high-sensitivity C-reactive protein in the elderly: Korea National Health and Nutrition Examination Survey (KNHANES) 2016–2017
- Relationship between long-term PM2.5 exposure and myopia prevalence in adults: analysis of the Korea National Health and Nutrition Examination Survey–Air Pollution Linked Data, 2020
- Exploring the impact of age and socioeconomic factors on health-related unemployment using propensity score matching: results from Korea National Health and Nutrition Examination Survey (2015–2017)
Occupational determinants of national health screening participation: an analysis of the Korea National Health and Nutrition Examination Survey (KNHANES), 2007–2023
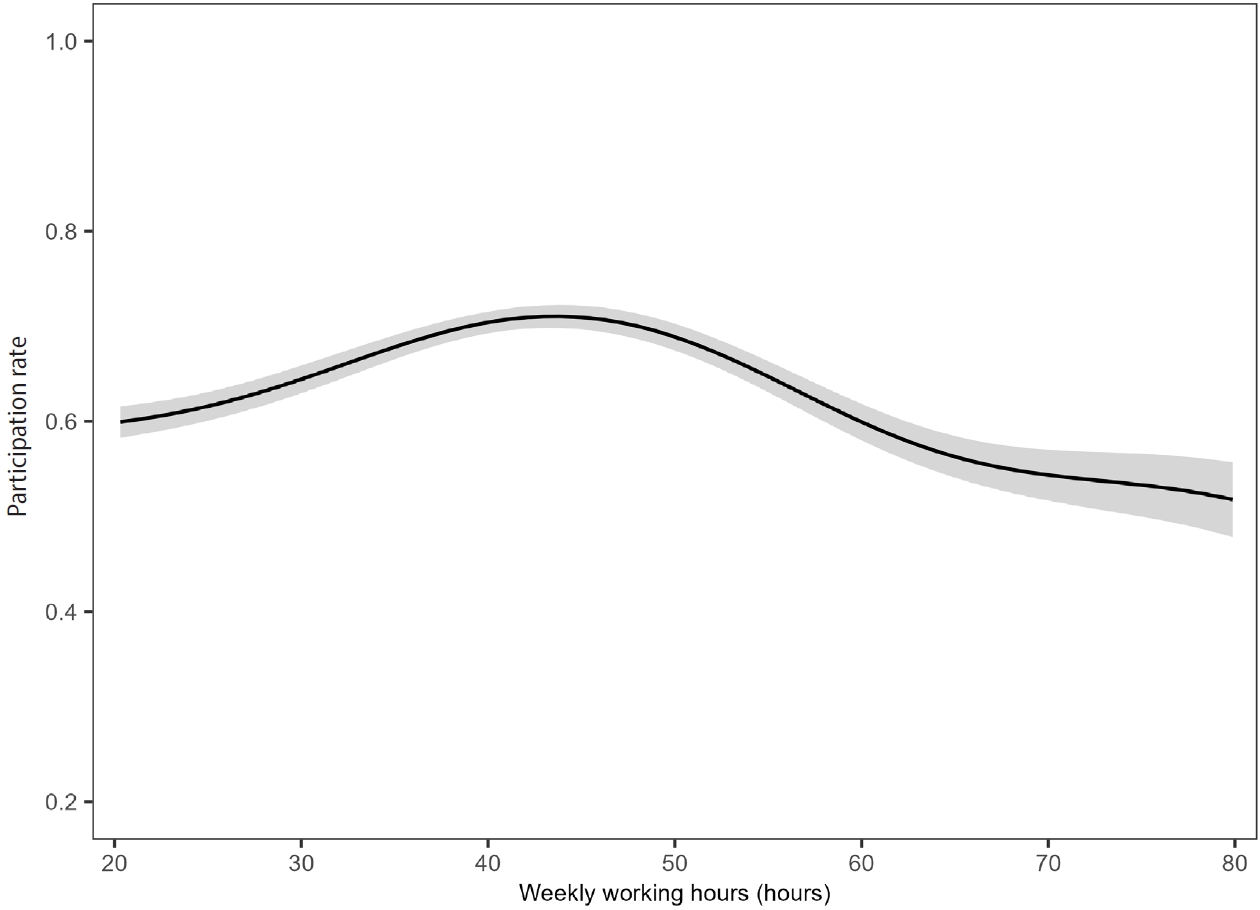
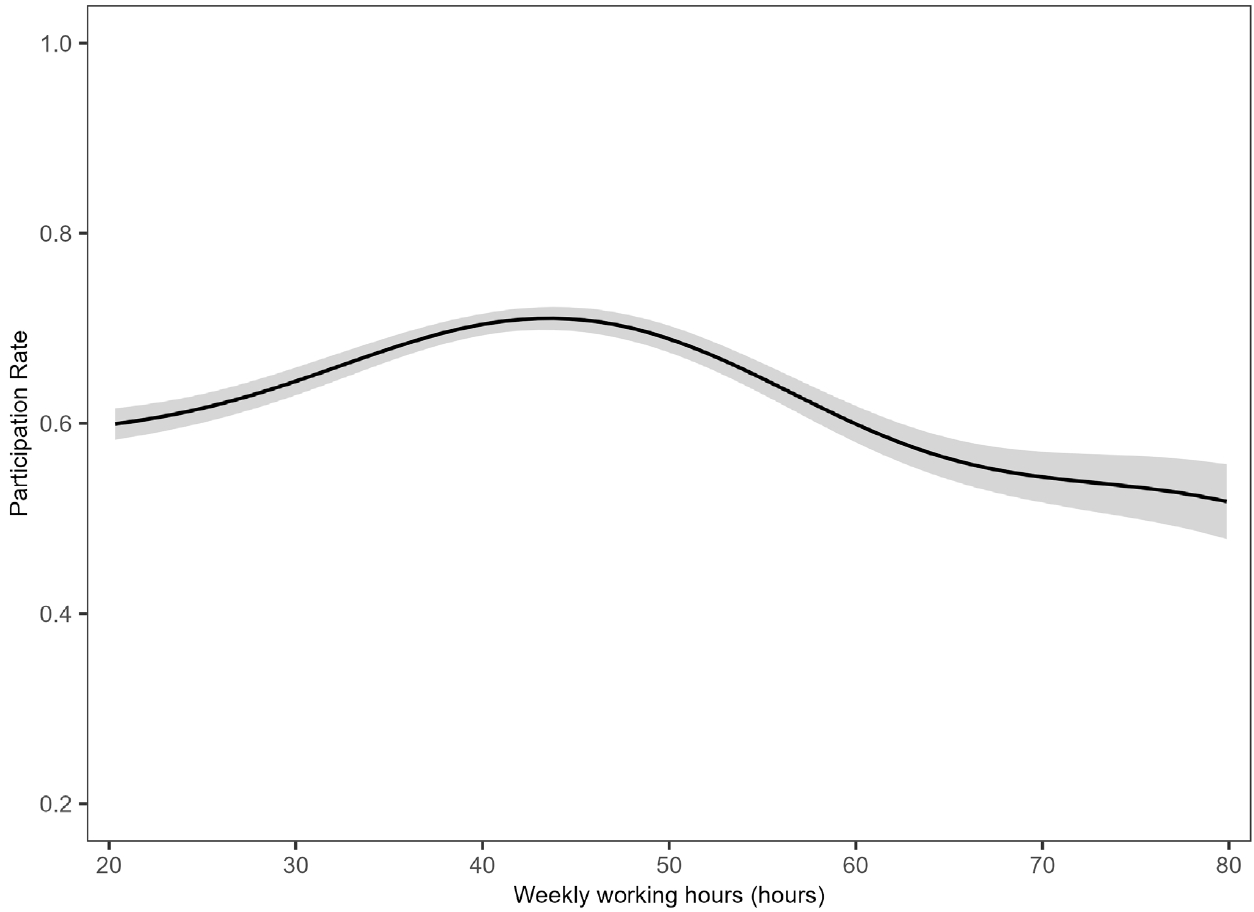
Fig. 1. Selection flow of study participants. KNHANES: Korea National Health and Nutrition Examination Survey.
Fig. 2. Nonlinear association between weekly working hours and participation rates.
Fig. 1.
Fig. 2.
Occupational determinants of national health screening participation: an analysis of the Korea National Health and Nutrition Examination Survey (KNHANES), 2007–2023
| Characteristic | Participants | Health examinations within the past two years | |
|---|---|---|---|
| No. | Examination rate (%) | ||
| Total | 37,987 | 27,093 | 71.3 |
| Sex | |||
| Male | 19,108 | 14,191 | 74.3 |
| Female | 18,879 | 12,902 | 68.3 |
| Age group | |||
| 20s and 30s | 15,115 | 8,777 | 58.1 |
| 40s and 50s | 16,257 | 13,185 | 81.1 |
| 60s or above | 6,615 | 5,131 | 77.6 |
| Survey year (Phase of KNHANES) | |||
| 2007 (IV) | 935 | 565 | 60.4 |
| 2008 (IV) | 2,211 | 1,337 | 60.5 |
| 2009 (IV) | 2,641 | 1,663 | 63.0 |
| 2010 (V) | 2,219 | 1,464 | 66.0 |
| 2011 (V) | 2,161 | 1,434 | 66.4 |
| 2012 (V) | 2,003 | 1,354 | 67.6 |
| 2013 (VI) | 2,166 | 1,515 | 69.9 |
| 2014 (VI) | 1,911 | 1,304 | 68.2 |
| 2015 (VI) | 2,023 | 1,406 | 69.5 |
| 2016 (VII) | 2,429 | 1,768 | 72.8 |
| 2017 (VII) | 2,494 | 1,890 | 75.8 |
| 2018 (VII) | 2,673 | 2,026 | 75.8 |
| 2019 (VIII) | 2,720 | 2,072 | 76.2 |
| 2020 (VIII) | 2,354 | 1,806 | 76.7 |
| 2021 (VIII) | 2,328 | 1,781 | 76.5 |
| 2022 (IX) | 2,154 | 1,683 | 78.1 |
| 2023 (IX) | 2,565 | 2,025 | 78.9 |
| Characteristic | No./Participants (%) | Prevalence ratio (95% CI) |
|---|---|---|
| Classification of occupations | ||
| Managers | 587/697 (84.2) | 1.00 (reference) |
| Professionals | 6,315/8,500 (74.3) | 0.88 (0.85–0.92) |
| Clerks | 6,172/8,019 (77.0) | 0.92 (0.89–0.95) |
| Service workers | 2,711/4,256 (63.7) | 0.79 (0.76–0.82) |
| Sales workers | 1,429/2,571 (55.6) | 0.68 (0.65–0.71) |
| Skilled agricultural, forestry and fishery workers | 117/185 (63.2) | 0.76 (0.67–0.85) |
| Craft and related trades workers | 2,135/3,053 (69.9) | 0.83 (0.80–0.87) |
| Plant, machine operators and assemblers | 2,390/2,994 (79.8) | 0.95 (0.92–0.99) |
| Elementary occupations | 5,090/7,549 (67.4) | 0.82 (0.79–0.85) |
| Armed forces | 123/129 (95.4) | 1.13 (1.08–1.19) |
| Employment status | ||
| Regular workers | 20,927/26,613 (78.6) | 1.00 (reference) |
| Temporary workers | 4,308/7,921 (54.4) | 0.72 (0.70–0.73) |
| Daily workers | 1,827/3,391 (53.9) | 0.71 (0.69–0.73) |
| Regular employment | ||
| Regular employment | 10,271/12,027 (85.4) | 1.00 (reference) |
| Non-regular employment | 9,000/13,662 (65.9) | 0.78 (0.77–0.79) |
| Work arrangement | ||
| Full-time | 13,143/18,370 (71.6) | 1.00 (reference) |
| Part-time | 2,509/4,737 (53.0) | 0.78 (0.76–0.81) |
| Work schedules | ||
| Mainly works during daytime | 3,123/4,740 (65.9) | 1.00 (reference) |
| Also works during other hours | 432/1,032 (41.9) | 0.67 (0.63–0.73) |
| Dispatched or contracted work | ||
| No | 7,161/11,083 (64.6) | 1.00 (reference) |
| Dispatch worker | 179/319 (56.1) | 0.86 (0.78–0.95) |
| Contract worker | 454/712 (63.8) | 0.98 (0.92–1.03) |
| Supervisory position | ||
| No | 4,086/6,959 (58.7) | 1.00 (reference) |
| Yes | 2,345/3,134 (74.8) | 1.25 (1.22–1.29) |
| Contingent work | ||
| No | 6,657/10,066 (66.1) | 1.00 (reference) |
| Yes | 423/896 (47.2) | 0.71 (0.66–0.76) |
| Work from home | ||
| No | 6,301/9,838 (64.1) | 1.00 (reference) |
| Yes | 116/237 (49.0) | 0.76 (0.66–0.86) |
| Working hour by group (hours) | ||
| <35 | 6,225/10,128 (61.5) | 0.83 (0.81–0.84) |
| 35–52 | 16,521/21,555 (76.7) | 1.00 (reference) |
| >52 | 4,347/6,304 (69.0) | 0.90 (0.89–0.92) |
| Characteristic | No./Participants (%) | Prevalence ratio (95% CI) |
|---|---|---|
| Clean and pleasant work environment | ||
| Not at all | 113/197 (57.4) | 1.00 (reference) |
| No | 664/1,053 (63.1) | 1.10 (0.97–1.25) |
| Yes | 2,156/3,580 (60.2) | 1.06 (0.94–1.20) |
| Very much | 626/949 (66.0) | 1.16 (1.02–1.32) |
| Risk of accidents | ||
| Not at all | 1,115/1,872 (59.6) | 1.00 (reference) |
| No | 1,350/2,254 (59.9) | 1.01 (0.96–1.06) |
| Yes | 957/1,456 (65.7) | 1.10 (1.04–1.15) |
| Very much | 137/197 (69.5) | 1.15 (1.05–1.27) |
| Working under time pressure | ||
| Not at all | 394/705 (55.9) | 1.00 (reference) |
| No | 1,761/2,920 (60.3) | 1.07 (1.00–1.15) |
| Yes | 1,205/1,872 (64.4) | 1.13 (1.05–1.21) |
| Very much | 198/280 (70.7) | 1.24 (1.12–1.37) |
| Decision-making authority | ||
| Not at all | 150/299 (50.2) | 1.00 (reference) |
| No | 942/1,617 (58.3) | 1.15 (1.02–1.30) |
| Yes | 2,216/3,493 (63.4) | 1.23 (1.10–1.38) |
| Very much | 249/367 (67.9) | 1.31 (1.15–1.50) |
| Being respected and trusted | ||
| Not at all | 26/48 (54.2) | 1.00 (reference) |
| No | 338/564 (59.9) | 1.10 (0.85–1.44) |
| Yes | 2,941/4,760 (61.8) | 1.13 (0.88–1.47) |
| Very much | 248/396 (62.6) | 1.15 (0.88–1.50) |
| Prolonged uncomfortable positions | ||
| Not at all | 647/992 (65.2) | 1.00 (reference) |
| No | 2,035/3,272 (62.2) | 0.95 (0.90–1.00) |
| Yes | 784/1,350 (58.1) | 0.89 (0.83–0.95) |
| Very much | 88/160 (55.0) | 0.84 (0.72–0.97) |
| Heavy material handling | ||
| Not at all | 1,246/1,913 (65.1) | 1.00 (reference) |
| No | 1,534/2,503 (61.3) | 0.94 (0.90–0.99) |
| Yes | 676/1,158 (58.4) | 0.90 (0.85–0.96) |
| Very much | 103/204 (50.5) | 0.77 (0.67–0.89) |
| Emotional labor | ||
| Not at all | 407/710 (57.3) | 1.00 (reference) |
| No | 1,827/2,934 (62.3) | 1.08 (1.00–1.15) |
| Yes | 1,232/1,957 (63.0) | 1.08 (1.01–1.16) |
| Very much | 93/178 (52.3) | 0.92 (0.79–1.07) |
| Hazardous chemical substances | ||
| Not exposed | 3,043/5,027 (60.5) | 1.00 (reference) |
| Exposed but not a serious problem | 439/630 (69.7) | 1.14 (1.08–1.21) |
| Exposed and seriously problematic | 76/121 (62.8) | 1.03 (0.90–1.18) |
| Air pollutant | ||
| Not exposed | 2,122/3,411 (62.2) | 1.00 (reference) |
| Exposed but not a serious problem | 1,177/1,959 (60.1) | 0.97 (0.93–1.01) |
| Exposed and seriously problematic | 259/408 (63.5) | 1.02 (0.95–1.10) |
| Dangerous tools, machines, equipment | ||
| Not exposed | 2,672/4,424 (60.4) | 1.00 (reference) |
| Exposed but not a serious problem | 766/1,185 (64.6) | 1.07 (1.02–1.12) |
| Exposed and seriously problematic | 118/166 (71.1) | 1.17 (1.06–1.29) |
| Fire, burns, and electrical shock | ||
| Not exposed | 2,973/4,881 (60.9) | 1.00 (reference) |
| Exposed but not a serious problem | 505/783 (64.5) | 1.06 (1.00–1.12) |
| Exposed and seriously problematic | 78/111 (70.3) | 1.16 (1.03–1.31) |
| Noise | ||
| Not exposed | 2,275/3,775 (60.3) | 1.00 (reference) |
| Exposed but not a serious problem | 986/1,600 (61.6) | 1.02 (0.98–1.07) |
| Exposed and seriously problematic | 296/400 (74.0) | 1.22 (1.15–1.30) |
| Infectious agents | ||
| Not exposed | 3,153/5,165 (61.1) | 1.00 (reference) |
| Exposed but not a serious problem | 350/523 (66.9) | 1.09 (1.02–1.16) |
| Exposed and seriously problematic | 54/87 (62.1) | 1.01 (0.86–1.19) |
Table 1. Health examination rates by general characteristics of study participants
KNHANES: Korea National Health and Nutrition Examination Survey.
Table 2. Participation rates and prevalence ratios for health examination by occupational characteristics
CI: confidence interval.
Table 3. Participation rates and prevalence ratios for health examination by workplace conditions and hazard exposures
CI: confidence interval.


