 KSOEM
KSOEM

Articles
- Page Path
- HOME > Ann Occup Environ Med > Volume 38; 2026 > Article
- Original Article The association between commute time and both presenteeism and absenteeism: a cross-sectional analysis of the 6th Korean Working Conditions Survey
-
Tae Jin Ahn
 , Young-Sun Min, Soon-Chan Kwon, Jisuk Yun, Sang-Ho Oh, Eun-Chul Jang,*
 -
Annals of Occupational and Environmental Medicine 2026;38:e31.
DOI: https://doi.org/10.35371/aoem.2026.38.e31
Published online: July 21, 2026
Department of Occupational and Environmental Medicine, Soonchunhyang University Cheonan Hospital, Cheonan, Korea
- *Corresponding author Eun-Chul Jang Department of Occupational and Environmental Medicine, Soonchunhyang University Cheonan Hospital, 31 Suncheonhyang 6-gil, Dongnam-gu, Cheonan 31151, Korea E-mail: oemdr10@gmail.com
• Received: April 17, 2026 • Revised: July 3, 2026 • Accepted: July 4, 2026
© 2026 Korean Society of Occupational & Environmental Medicine
This is an Open Access article distributed under the terms of the Creative Commons Attribution Non-Commercial License (https://creativecommons.org/licenses/by-nc/4.0/) which permits unrestricted non-commercial use, distribution, and reproduction in any medium, provided the original work is properly cited.
- 280 Views
- 16 Download


Abstract
-
Background This study examined whether longer commute time is associated with presenteeism and absenteeism among Korean wage workers, in the context of Korea’s comparatively long commutes and growing concerns about work-related productivity loss in an increasingly urbanized society.
-
Methods We analyzed 28,349 wage workers from the 6th Korean Working Conditions Survey, excluding individuals younger than 20 years, foreign nationals, telecommuters, self-employed workers, unpaid family workers, and those with missing or incomplete data. Commute time was categorized into ≤60, 61–120, and ≥121 minutes per day. Presenteeism was defined as having worked while sick in the past 12 months (or since starting the current job), and absenteeism as having at least one day of sickness-related absence during the same period. Sex-stratified, survey-weighted multiple logistic regression analyses were performed to estimate odds ratios and 95% confidence intervals while accounting for the complex survey design.
-
Results Overall, 82.1% of workers reported commuting ≤60 minutes, 11.2% reported presenteeism, and 3.9% reported absenteeism. Among men, commute times of 61–120 and ≥121 minutes were associated with higher odds of presenteeism, and ≥121 minutes with higher odds of absenteeism compared with ≤60 minutes. Among women, commute times of 61–120 and ≥121 minutes were associated with higher odds of presenteeism, and ≥121 minutes with higher odds of absenteeism, indicating a similar but slightly more pronounced pattern.
-
Conclusions Longer commute times were associated with increased odds of both presenteeism and absenteeism among Korean wage workers. In particular, women with commute times of ≥121 minutes showed higher odds of presenteeism than men. Commute time should be recognized as a modifiable factor relevant to occupational health in workplace and public policy, and further longitudinal research is needed to clarify causal pathways and to inform targeted interventions aimed at reducing commuting-related productivity loss.
BACKGROUND
As urbanization and metropolitan concentration accelerate worldwide, commute distance and time have continued to increase.1 Korea is no exception. Due to overcrowding in the Seoul metropolitan area, Korea has one of the longest average commutes in the Organisation for Economic Co-operation and Development (OECD).2 According to Statistics Korea, the average daily commute time for Korean workers is 73.9 minutes, but for those in the Seoul metropolitan area, it jumps to 82.0 minutes.3 In this context, commute time is a key determinant of workers' quality of life.4 Critically, the growing burden of commute time extends beyond individual lifestyle choices and reflects a structural societal issue that demands policy-level attention.5,6
Long commutes deplete workers' time resources and reduce their opportunities to recover, thereby exacerbating occupational stress and contributing to productivity losses at the macro level.7,8 These stress-related burdens are closely tied to a wide range of adverse health outcomes. Empirical evidence consistently links long commute times to physical health consequences, including cardiovascular disease, musculoskeletal disorders, and sleep disturbances, as well as psychological outcomes, such as depressive symptoms, reduced job satisfaction, and diminished overall well-being.4,9-12
This study focuses on two key indicators of work-related productivity loss—presenteeism and absenteeism—and examines the consequences of commute time.13,14 Originally conceptualized as working while sick,15 presenteeism has since been broadened to encompass a range of health-related productivity impairments during working hours.16 Work environments increasingly recognize that sustaining health and concentration during work hours, rather than merely attending, is a critical determinant of work quality.16 Absenteeism, on the other hand, has been broadly defined as absence from scheduled work due to illness, injury, or other health-related reasons.15 It has long been regarded as a visible and immediate marker of workforce disruption. Recently, however, absenteeism has been understood to reflect not only objective health impairment, but also psychological factors, such as burnout and disengagement.17
Although several studies have examined the relationship between commute time and work-related productivity loss,13,18 studies that specifically address the situation in South Korea remain scarce. To our knowledge, no study has directly examined the association between commute time and both presenteeism and absenteeism among Korean wage workers using nationally representative data. Therefore, this study aimed to investigate the association between commute time and both presenteeism and absenteeism among Korean wage workers, using data from the 6th Korean Working Conditions Survey (KWCS).
METHODS
From 2020 to 2021, the Korea Institute of Occupational Safety and Health conducted the 6th KWCS. Since 2006, the KWCS has been a large-scale national survey investigating occupational and environmental factors to provide preliminary data for improving working conditions.19
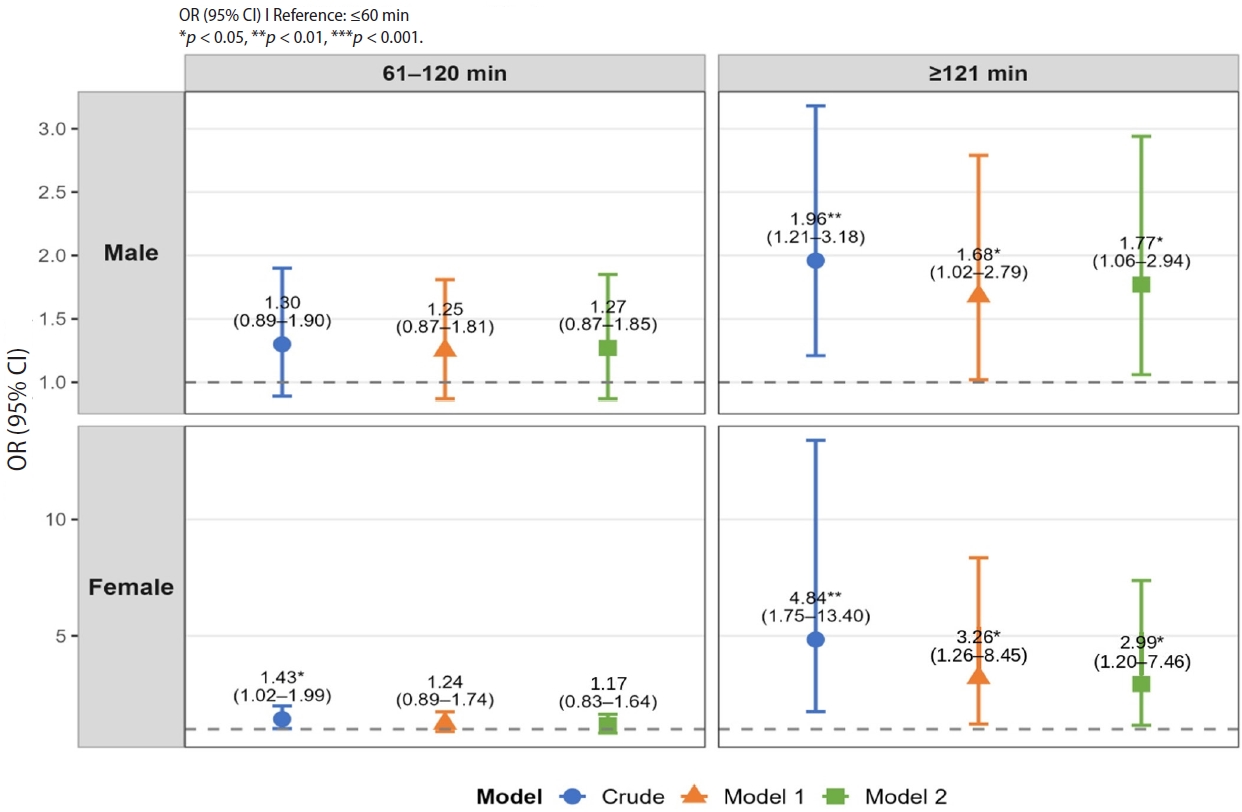
A total of 50,538 people responded to the 6th KWCS. Of these, 153 individuals under the age of 20 and 288 foreign nationals were excluded. After accounting for commute time, an additional 2,788 telecommuters were excluded from the analysis. This study focused exclusively on wage workers, thereby excluding 15,134 self-employed individuals and unpaid family workers. Additionally, 3,826 participants with missing or incomplete data were excluded. Finally, the study included 28,349 wage workers (Fig. 1). After applying pre-designed weights to represent all workers at the national level, the total study population was 32,530 individuals.
In this study, the dependent variables were presenteeism and absenteeism, and the main independent variable was commute time, which was used to examine their associations. Covariates were constructed based on factors related to these variables. The definitions of the variables are as follows.
Presenteeism was evaluated using the question "Over the past 12 months (or since you started your job), did you work when you were sick?" Responses to this question were categorized as "yes," "no," or "I wasn't sick." A "yes" response indicated presenteeism, while the other responses did not.
Absenteeism was evaluated using the question "Over the past 12 months (or since you started your job), how many days in total were you absent from work due to sick leave or health-related leave?" Responses to this question were coded as "yes" if the respondent was absent for at least one day, and as "no" if they were not.
Commute time was evaluated using the question: "In total, how many minutes per day do you usually spend traveling from home to work and back?" Responses were categorized as follows: ≤60 minutes, 61–120 minutes, and ≥121 minutes.20
To account for potential confounding factors, this study incorporated a range of general and occupational characteristics.21-25 General characteristics are as follows. The age variable was divided into five groups (20–29, 30–39, 40–49, 50–59, and ≥60 years). Self-rated health status was assessed using the following question: "How is your health in general? Would you say it is…" There were five response options: "very good," "good," "fair," "bad," and "very bad." Responses were dichotomized into "good" (responses of "very good" or "good") and "bad" (responses of "fair," "bad," or "very bad"). The education variable was categorized into three levels: middle school or lower, high school, and college graduate or higher. Monthly income was divided into four groups, ranging from less than 2 million Korean won (KRW) to 4 million KRW or more. Regarding occupational factors, occupational roles were organized into three clusters: white-collar (managerial, professional, and office roles), pink-collar (service and sales), and blue-collar (agriculture, manual labor, and technical operations). Company size was assessed by the number of employees (<50, 50–299, or ≥300), and shift work was classified as either yes or no. Finally, weekly working hours were classified into three groups: <40, 40–52, and >52 hours.
In this study, the χ2 test was used to determine the levels of presenteeism and absenteeism by general and occupational characteristics of the participants. To examine the association between commute time and both presenteeism and absenteeism, we performed sex-stratified survey-weighted multiple logistic regression analyses. Odds ratios (ORs) were reported across three models: a crude model, model 1 (adjusted for age, self-rated health status, education, and income), and model 2 (adjusted for model 1 + occupational type, company size, weekly working hours, and shift work). In addition to the sex-stratified analyses, an interaction term (commute time × sex) was incorporated into each model (crude, model 1, and model 2) applied to the total study population to formally evaluate whether sex modified the association between commute time and the outcomes. The statistical significance of the interaction was assessed using the Wald test. Finally, to further enhance the interpretability of the findings, adjusted predicted probabilities of both presenteeism and absenteeism were estimated across all three models using marginal standardization, and the absolute probability differences between the baseline commute group (≤60 minutes) and the long commute group (≥121 minutes) were calculated and stratified by sex. As a sensitivity analysis, we additionally modeled commute time as a continuous variable (minutes) and examined its association with presenteeism and absenteeism.
All analyses incorporated sampling weights and stratification to account for the complex survey design.
The number of participants, proportion (%), and all analyses were performed using weighted data. All statistical analyses were performed using R software version 4.5.2 (R Foundation for Statistical Computing, Vienna, Austria). A p-value < 0.05 was considered statistically significant.
The present study protocol was reviewed and approved by the Institutional Review Board of Soonchunhyang University Hospital in Cheonan (IRB No. SCHCA 2023-08-037). The requirement for informed consent was waived due to the retrospective nature of the study.
RESULTS
The general and occupational characteristics of the study group are presented in Table 1. Tables 2 and 3 present general and occupational characteristics of participants according to presenteeism and absenteeism, by sex.
Table 1 shows the unweighted sample sizes and the weighted estimates. According to the weighted estimates in Table 1, the majority of participants (82.1%) reported a commute time of 60 minutes or less, while 15.1% reported a commute time of 61–120 minutes, and 2.8% reported a commute time of 121 minutes or more. The prevalence of presenteeism was 11.2%, and 3.9% of participants reported absenteeism.
Regarding presenteeism (Table 2), male workers showed statistically significant associations with age, self-rated health status, occupational type, shift work, working hours, and commute time. Among female workers, self-rated health status, income, occupational type, company size, shift work, working hours, and commute time were significantly associated with presenteeism. Regarding absenteeism (Table 3), self-rated health status, working hours, and commute time were significantly associated with absenteeism among male workers. Among female workers, self-rated health status, education, income, occupational type, company size, working hours, and commute time were statistically significantly associated with absenteeism.
Fig. 2 shows the ORs for the association between commute time and presenteeism, and Fig. 3 shows those for the association between commute time and absenteeism, both stratified by sex. As shown in Fig. 2, long commute times were significantly associated with presenteeism among male workers. The ORs were higher than those of the ≤60 minutes group in the 61–120 minutes group (OR: 1.35; 95% confidence interval [CI]: 1.07–1.70) and ≥121 minutes group (OR: 1.49; 95% CI: 1.00–2.23). Among female workers, significant associations with presenteeism were also observed in both the 61–120 minutes group (OR: 1.24; 95% CI: 1.01–1.52) and the ≥121 minutes group (OR: 2.59; 95% CI: 1.52–4.41). Notably, the OR for women in the ≥121 minutes group (2.59) was higher than that for men (1.49).
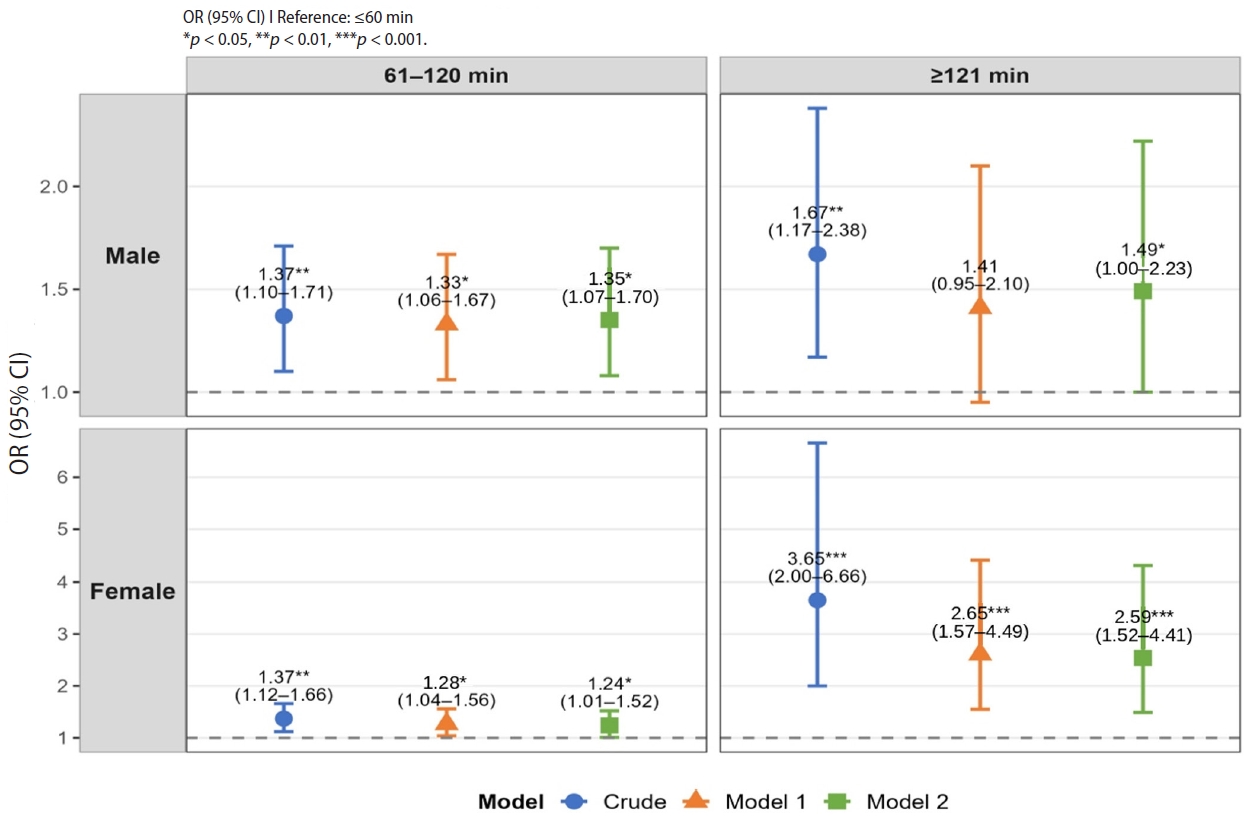
As shown in Fig. 3, a significant increase in the OR (1.77; 95% CI: 1.06–2.94) was observed only in the ≥121 minutes group among men. Among women, the OR was 2.99 (95% CI: 1.20–7.46) in the ≥121 minutes group, which was higher than that observed in men. The specific values from the overall results of the logistic regression analysis are presented in Supplementary Table 1.
According to Table 4, the predicted probability of presenteeism among men increased by 3.67 percentage points in the fully adjusted model (model 2) from 9.17% in the ≤60 minutes group to 12.84% in the ≥121 minutes group. Meanwhile, the predicted probability of absenteeism increased by 2.40 percentage points, from 3.44% to 5.84%. Among women, the predicted probability of presenteeism increased by 13.10 percentage points, from 12.56% to 25.66%, while the predicted probability of absenteeism increased by 6.46 percentage points, from 3.84% to 10.30%.
Supplementary Table 1 shows the ORs for the association between commute time and both presenteeism and absenteeism, stratified by sex, for the crude model, model 1, and model 2. Despite the stepwise addition of the adjustment variables, the direction and magnitude of the increased odds in the ≥121 minutes group remained consistent for both sexes, although the OR was higher for women. Furthermore, trend tests revealed statistically significant dose-response relationships for both presenteeism and absenteeism in both sexes. The trend OR for presenteeism was 1.28 (95% CI: 1.09–1.50) for men and 1.43 (95% CI: 1.18–1.73) for women, and the trend OR for absenteeism was 1.30 (95% CI: 1.03–1.66) for men and 1.51 (95% CI: 1.04–2.19) for women. The unweighted sample sizes for each commute time group, stratified by sex, are presented in the footnote of Supplementary Table 1.
According to Supplementary Table 2, the interaction term between commute time (≥121 minutes) and sex was statistically significant for presenteeism in the crude model and model 1, but not in model 2. For absenteeism, neither model showed a statistically significant interaction between commute time and sex.
In a sensitivity analysis treating commute time as a continuous variable (minutes), longer commute times were significantly associated with higher odds of both outcomes for both sexes (Supplementary Table 3). In this analysis, ORs represent the change in odds associated with a one-minute increase in commute time.
Due to concerns that self-rated health status might act as a mediator, we conducted a sensitivity analysis in which this variable was excluded from the models (Supplementary Table 4). There was no significant change to the estimated associations between commute time and both presenteeism and absenteeism. This suggests that the results of this study are robust with regard to this variable.
DISCUSSION
This study examined how commute time relates to two work-related health outcomes, presenteeism and absenteeism, among Korean workers using a sex-stratified analytical approach. A dose-response pattern was observed, in which the OR increased as commute time increased in both presenteeism and absenteeism. While a statistically significant association with presenteeism was found for moderate commute times (61–120 minutes) in both men and women, no significant association with absenteeism emerged at this level. However, significant associations were identified for both presenteeism and absenteeism when commute times exceeded 120 minutes. Notably, women had higher odds than men for both presenteeism and absenteeism in the ≥121 minutes category. In model 2, however, the interaction between commute time and sex was not statistically significant for either presenteeism or absenteeism. Therefore, these sex-specific differences should be interpreted as descriptive patterns rather than statistically confirmed effect modification.
Notably, women had a higher baseline level of presenteeism than men. In this study, the predicted probability of presenteeism was higher for women (12.56%) than for men (9.17%) in the ≤60 minutes group. This suggests that women were at a disadvantage even before considering the additional burden of commuting. Furthermore, women experienced a greater percentage point increase in both presenteeism and absenteeism. This suggests that the observed sex differences in the ORs are also reflected in substantial differences in the predicted probabilities.
In today’s workplace, there is growing recognition that presenteeism leads to greater and more hidden productivity losses than absenteeism, because reduced work performance during working hours may be difficult to detect within an organization.16,26 On the other hand, absenteeism is not merely about missing work due to illness; it is a phenomenon where burnout, apathy toward work, and chronic workplace stress accumulate over time, leaving individuals feeling exhausted.17 Taken together, the two capture distinct but overlapping facets of how health problems erode productivity, with real consequences not just for individual organizations but for society as a whole.27
Previous studies have consistently found a positive association between commute time and both presenteeism and absenteeism. In Germany, a study using longitudinal panel data found that long commute times were associated with increased absenteeism.28 A study using data from Chinese workplaces found a significant association between commute time and absenteeism, suggesting that long commute time may be associated with higher odds of absenteeism.29 A quasi-longitudinal study of Australians examined the direct association between commute time and presenteeism.14 Similarly, a study based on the British Household Panel Survey suggested that commute time has a negative impact on self-rated health and productivity.30 Furthermore, by empirically suggesting that the stress of the morning commute reduces work flow and engagement, the study explained the psychological mechanisms underlying presenteeism.31
Several mechanisms help explain why long commutes tend to increase both presenteeism and absenteeism. Being stuck in traffic or spending extended periods on crowded public transport is physically and mentally exhausting. This leaves individuals feeling stressed, fatigued, and sleep-deprived by the time they arrive at work. One effective way to frame this is through the Effort-Recovery Model: when commuting effectively adds unpaid hours to the workday, workers arrive at their next shift without having properly recovered, which negatively impacts their performance.32 Wang et al.29 reported that depressive symptoms and sleep loss are key factors in the commute-productivity pathway. This pattern also applies to the Korean context. Longer commutes have been linked to higher rates of depression and anxiety among Korean workers,33 both of which are well-known factors that contribute to presenteeism or absenteeism.34 Furthermore, work-family conflict has been linked to both presenteeism and absenteeism.35 Among Korean wage workers, in particular, longer commute times were associated with higher levels of work-family conflict.36 These findings suggest that the chronic time constraints resulting from long commutes can hinder recovery and increase chronic stress, thereby contributing to both presenteeism and absenteeism.
In Korean society, this phenomenon may be further exacerbated by a workplace culture characterized by low sick leave rates and an unspoken expectation that employees should come to work even when they are sick.24 Korea has one of the lowest rates of sick leave usage in the OECD,37 with a disproportionately high rate of presenteeism relative to absenteeism,38 suggesting that Korean workers feel compelled to attend work even when sick. When organizational culture frames working while sick as a sign of dedication, presenteeism becomes not just a health issue but also a matter of adapting to the group.24
Meanwhile, compared to men, women with commute times of ≥121 minutes had notably higher odds of both presenteeism and absenteeism. In light of the situation faced by women, who bear the double burden of the pressures of paid employment and disproportionate responsibilities for household chores and childcare,39,40 the finding that longer commutes are associated with both presenteeism and absenteeism can be understood. Previous studies suggest that women exhibit higher rates of both than men, particularly in poor psychosocial work environments.41,42 Roberts et al.39 found that commuting significantly impacted women's psychological health negatively but not men's, attributing this to women's greater domestic responsibilities. A Korean study also found that commute time was associated with increased depression among women across all long-commute categories, while no significant association was observed in men.33 These findings are consistent with previous research and suggest that women’s heightened sensitivity to the burden of commuting may partly explain the observed patterns. These sex differences may stem from structural factors in the Korean labor market, where women are more likely to occupy positions with low occupational autonomy and unstable employment.43 Consequently, the burden of going to work intensifies, adding to the strain already caused by household responsibilities.24,39 Although these structural and role-related factors are important, biological and psychosocial factors that were not assessed in this study may also influence sex differences in stress sensitivity and the recovery gap.44,45 This suggests that the observed gap is influenced by the combined effects of biological and social factors. However, this study did not measure these biological and social factors. As a result, this remains a mere hypothesis requiring further investigation.
The findings of this study have significant implications for occupational health policy. Presenteeism is associated with long-term productivity loss and deteriorating health. Therefore, the consistent relationship between commuting and presenteeism requires policy attention.5,6,16 Flexible work arrangements, such as remote work options and flexible start times, can help alleviate the health burden associated with commuting.46 Employers and policymakers should recognize commute time as a modifiable factor relevant to occupational health, particularly in densely urbanized areas like Korea, where long commutes are prevalent.2,6,47 However, it should be noted that alternatives such as remote work do not necessarily yield uniformly positive effects, and their implementation should be approached with careful consideration of contextual factors.48
This study has several limitations. First, it relies on secondary data from the 6th KWCS, a nationally representative cross-sectional survey conducted with standardized questionnaires. Due to the survey's large scale, respondents may not have fully grasped the nuances of certain constructs. Additionally, the KWCS lacks validated scales to measure absenteeism and presenteeism as defined in the occupational health literature.49,50 As in previous studies using large-scale survey data on commuting and work outcomes, unmeasured confounders such as commuting mode, caregiving responsibilities, job insecurity, and characteristics of the psychosocial work environment may have influenced the observed associations.20 Therefore, residual confounders cannot be ruled out, and the estimated associations should be interpreted with caution. Second, since most variables were self-reported, they may be subject to recall bias. Third, the cross-sectional design precludes definitive causal inference and prevents us from determining the temporal order between commute time and presenteeism or absenteeism. Longitudinal studies focusing on Korean populations are necessary to determine the temporal sequence of these associations.
Despite these limitations, this study has the following strengths. To the best of our knowledge, it is the first study to examine the association between commute time and work-related productivity losses using nationally representative data from the Korean workforce. Based on the 6th KWCS, which reflects the demographic and occupational characteristics of the Korean workforce, this study provides population-level evidence that goes beyond findings from single-firm or regional studies. Second, we assessed work-related productivity losses comprehensively by analyzing both presenteeism and absenteeism simultaneously. These are key indicators of work-related productivity loss, a primary concern in today’s labor market. Third, we quantitatively evaluated sex differences in the Korean context using sex-stratified analyses and tests of the interaction between commute time and sex. These findings highlight the potential significance of long commutes as a focus of occupational health policies and workplace interventions in Korea. Further investigation through longitudinal studies is warranted.
CONCLUSIONS
This study showed that among Korean wage workers, longer commute times are associated with higher odds of presenteeism and absenteeism. Notably, the association with presenteeism was more consistent across commute time categories than the association with absenteeism. These findings support the view that commute time should be recognized as a modifiable factor relevant to occupational health that warrants attention in workplace and public policy development. Further longitudinal studies focused on the Korean population are necessary to clarify causal relationships and to create more targeted interventions.
Abbreviations
CI
confidence interval
KWCS
Korean Working Conditions Survey
OECD
Organisation for Economic Co-operation and Development
OR
odds ratio
-
Funding
This work was supported by the Soonchunhyang University Research Fund.
-
Competing interests
Young-Sun Min, a contributing editor of the Annals of Occupational and Environmental Medicine, was not involved in the editorial evaluation or decision to publish this article. All remaining authors have declared no conflicts of interest.
-
Author contributions
Conceptualization: Ahn TJ, Jang EC. Data curation: Ahn TJ, Jang EC, Kwon SC, Min YS, Yun J, Oh SH. Formal analysis: Ahn TJ, Jang EC, Kwon SC, Min YS, Yun J. Investigation: Ahn TJ, Jang EC, Yun J. Writing - original draft: Ahn TJ, Yun J. Writing - review & editing: Jang EC.
-
Acknowledgments
I would like to speak to my colleagues who have had a hard time. It's not your fault.
NOTES
SUPPLEMENTARY MATERIAL
Supplementary Table 1.
ORs of presenteeism and absenteeism according to commute time.
Supplementary Table 2.
Statistical significance of interaction term between sex and commute time.
Supplementary Table 3.
ORs of presenteeism and absenteeism according to continuous commute time.
Supplementary Table 4.
ORs of presenteeism and absenteeism according to commute time, excluding self-rated health status.
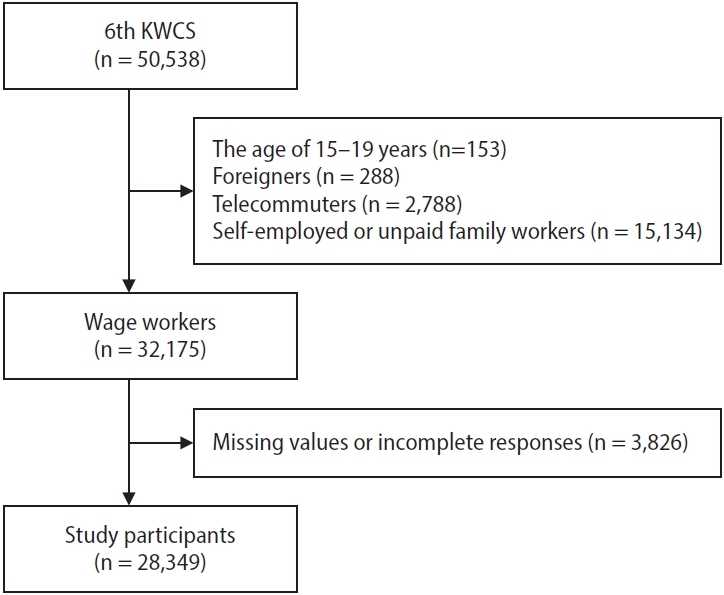
Fig. 2.
ORs of presenteeism according to commute time. Model 1: adjusted for age, self-rated health status, education, and income (10,000 KRW/month). Model 2: adjusted for age, self-rated health status, education, income (10,000 KRW/month), occupational type, company size, shift work, and working hours (hours/week). OR: odds ratio; CI: confidence interval.
Fig. 3.
ORs of absenteeism according to commute time. Model 1: adjusted for age, self-rated health status, education, and income (10,000 KRW/month). Model 2: adjusted for age, self-rated health status, education, income (10,000 KRW/month), occupational type, company size, shift work, and working hours (hours/week). OR: odds ratio; CI: confidence interval.
Table 1.
General and occupational characteristics of the study population
| Characteristic | No. (%) (n = 28,349) | No. (%) (n = 32,530)a |
|---|---|---|
| Sex | ||
| Male | 13,311 (47.0) | 18,499 (56.9) |
| Female | 15,038 (53.0) | 14,032 (43.1) |
| Age (years) | ||
| 20–29 | 3,706 (13.1) | 5,409 (16.6) |
| 30–39 | 6,176 (21.8) | 7,379 (22.7) |
| 40–49 | 6,894 (24.3) | 8,045 (24.7) |
| 50–59 | 6,551 (23.1) | 7,134 (21.9) |
| ≥60 | 5,022 (17.7) | 4,563 (14.0) |
| Self-rated health status | ||
| Good | 20,037 (70.7) | 23,554 (72.4) |
| Bad | 8,312 (29.3) | 8,977 (27.6) |
| Education | ||
| Middle school or below | 3,138 (11.1) | 2,720 (8.4) |
| High school | 9,684 (34.2) | 10,439 (32.1) |
| College or above | 15,527 (54.8) | 19,371 (59.5) |
| Income (10,000 KRW/month) | ||
| <200 | 8,919 (31.5) | 8,938 (27.5) |
| 200–299 | 9,675 (34.1) | 10,556 (32.5) |
| 300–399 | 5,750 (20.3) | 7,170 (22.0) |
| ≥400 | 4,005 (14.1) | 5,866 (18.0) |
| Occupational type | ||
| White collar | 12,613 (44.5) | 15,552 (50.8) |
| Pink collar | 6,590 (23.2) | 5,575 (16.6) |
| Blue collar | 9,146 (32.3) | 11,404 (32.6) |
| Working hours (hours/week) | ||
| <40 | 6,021 (21.2) | 6,144 (18.9) |
| 40–52 | 20,388 (71.9) | 24,287 (74.7) |
| >52 | 1,940 (6.8) | 2,099 (6.5) |
| Company size | ||
| <50 | 19,271 (68.0) | 20,592 (63.3) |
| 50–299 | 4,789 (16.9) | 6,186 (19.0) |
| ≥300 | 4,289 (15.1) | 5,753 (17.7) |
| Shift work | ||
| No | 25,612 (90.3) | 29,227 (89.8) |
| Yes | 2,737 (9.7) | 3,304 (10.2) |
| Commute time (minutes/day) | ||
| ≤60 | 24,253 (85.6) | 26,733 (82.1) |
| 61–120 | 3,523 (12.4) | 4,898 (15.1) |
| ≥121 | 573 (2.0) | 900 (2.8) |
| Presenteeism | ||
| No | 25,170 (88.8) | 28,873 (88.8) |
| Yes | 3,179 (11.2) | 3,657 (11.2) |
| Absenteeism | ||
| No | 27,262 (96.2) | 31,272 (96.1) |
| Yes | 1,087 (3.8) | 1,258 (3.9) |
Table 2.
General and occupational characteristics of the participants according to presenteeism
| Variable | Male | Female | ||||||
|---|---|---|---|---|---|---|---|---|
| Total | No presenteeism | Presenteeism | p-valuea | Total | No presenteeism | Presenteeism | p-valuea | |
| Age (years) | <0.001 | 0.358 | ||||||
| 20–29 | 2,563 | 2,423 (94.5) | 140 (5.5) | 2,846 | 2,512 (88.3) | 333 (11.7) | ||
| 30–39 | 4,565 | 4,116 (90.2) | 449 (9.8) | 2,814 | 2,427 (86.2) | 387 (13.8) | ||
| 40–49 | 4,839 | 4,269 (88.2) | 571 (11.8) | 3,206 | 2,767 (86.3) | 438 (13.7) | ||
| 50–59 | 4,024 | 3,590 (89.2) | 434 (10.8) | 3,110 | 2,676 (86.1) | 433 (13.9) | ||
| ≥60 | 2,507 | 2,289 (91.3) | 218 (8.7) | 2,056 | 1,803 (87.7) | 253 (12.3) | ||
| Self-rated health status | <0.001 | <0.001 | ||||||
| Good | 13,594 | 12,764 (93.9) | 830 (6.1) | 9,960 | 9,111 (91.5) | 849 (8.5) | ||
| Bad | 4,905 | 3,923 (80.0) | 981 (20.0) | 4,072 | 3,075 (75.5) | 997 (24.5) | ||
| Education | 0.227 | 0.123 | ||||||
| Middle school or below | 1,162 | 1,038 (89.4) | 123 (10.6) | 1,559 | 1,371 (88.0) | 188 (12.0) | ||
| High school | 5,973 | 5,347 (89.5) | 626 (10.5) | 4,466 | 3,916 (87.7) | 550 (12.3) | ||
| College or above | 11,364 | 10,302 (90.7) | 1,062 (9.3) | 8,007 | 6,899 (86.2) | 1,108 (13.8) | ||
| Income (10,000 KRW/month) | 0.078 | <0.001 | ||||||
| <200 | 2,824 | 2,607 (92.3) | 217 (7.7) | 6,114 | 5,443 (89.0) | 671 (11.0) | ||
| 200–299 | 5,114 | 4,614 (90.2) | 501 (9.8) | 5,442 | 4,640 (85.3) | 802 (14.7) | ||
| 300–399 | 5,471 | 4,916 (89.8) | 555 (10.2) | 1,698 | 1,455 (85.7) | 243 (14.3) | ||
| ≥400 | 5,089 | 4,551 (89.4) | 538 (10.6) | 777 | 648 (83.4) | 129 (16.6) | ||
| Occupational type | <0.01 | 0.018 | ||||||
| White collar | 8,346 | 7,583 (90.9) | 763 (9.1) | 7,206 | 6,177 (85.7) | 1,028 (14.3) | ||
| Pink collar | 1,945 | 1,816 (93.4) | 129 (6.6) | 3,630 | 3,201 (88.2) | 429 (11.8) | ||
| Blue collar | 8,207 | 7,288 (88.8) | 919 (11.2) | 3,196 | 2,807 (87.8) | 389 (12.2) | ||
| Company size | 0.154 | <0.001 | ||||||
| <50 | 10,508 | 9,540 (90.8) | 967 (9.2) | 10,084 | 8,865 (87.9) | 1,219 (12.1) | ||
| 50–299 | 3,822 | 3,404 (89.1) | 417 (10.9) | 2,364 | 1,993 (84.3) | 371 (15.7) | ||
| ≥300 | 4,169 | 3,743 (89.8) | 426 (10.2) | 1,584 | 1,328 (83.8) | 256 (16.2) | ||
| Shift work | <0.01 | <0.001 | ||||||
| No | 16,329 | 14,795 (90.6) | 1,533 (9.4) | 12,898 | 11,288 (87.5) | 1,610 (12.5) | ||
| Yes | 2,170 | 1,892 (87.2) | 278 (12.8) | 1,133 | 897 (79.2) | 236 (20.8) | ||
| Working hours (hours/week) | <0.001 | <0.001 | ||||||
| <40 | 2,121 | 1,975 (93.1) | 146 (6.9) | 4,023 | 3,637 (90.4) | 386 (9.6) | ||
| 40–52 | 14,866 | 13,442 (90.4) | 1,424 (9.6) | 9,421 | 8,068 (85.6) | 1,354 (14.4) | ||
| >52 | 1,512 | 1,271 (84.1) | 241 (15.9) | 587 | 481 (81.9) | 106 (18.1) | ||
| Commute time (minutes/day) | <0.001 | <0.001 | ||||||
| ≤60 | 14,557 | 13,235 (90.9) | 1,322 (9.1) | 12,176 | 10,678 (87.7) | 1,499 (12.3) | ||
| 61–120 | 3,318 | 2,919 (88.0) | 400 (12.0) | 1,580 | 1,326 (83.9) | 254 (16.1) | ||
| ≥121 | 624 | 535 (85.7) | 89 (14.3) | 276 | 183 (66.2) | 93 (33.8) | ||
Table 3.
General and occupational characteristics of the participants according to absenteeism
| Variable | Male | Female | ||||||
|---|---|---|---|---|---|---|---|---|
| Total | No absenteeism | Absenteeism | p-valuea | Total | No absenteeism | Absenteeism | p-valuea | |
| Age (years) | 0.109 | 0.246 | ||||||
| 20–29 | 2,563 | 2,470 (96.3) | 94 (3.7) | 2,846 | 2,735 (96.1) | 111 (3.9) | ||
| 30–39 | 4,565 | 4,384 (96.0) | 181 (4.0) | 2,814 | 2,676 (95.1) | 138 (4.9) | ||
| 40–49 | 4,839 | 4,621 (95.5) | 218 (4.5) | 3,206 | 3,070 (95.8) | 136 (4.2) | ||
| 50–59 | 4,024 | 3,894 (96.8) | 129 (3.2) | 3,110 | 2,978 (95.7) | 132 (4.3) | ||
| ≥60 | 2,507 | 2,447 (97.6) | 60 (2.4) | 2,056 | 1,997 (97.1) | 59 (2.9) | ||
| Self-rated health status | <0.001 | <0.001 | ||||||
| Good | 13,594 | 13,283 (97.7) | 311 (2.3) | 9,960 | 9,692 (97.3) | 268 (2.7) | ||
| Bad | 4,905 | 4,533 (92.4) | 372 (7.6) | 4,072 | 3,764 (92.4) | 308 (7.6) | ||
| Education | 0.976 | <0.01 | ||||||
| Middle school or below | 1,162 | 1,120 (96.4) | 42 (3.6) | 1,559 | 1,528 (98.0) | 31 (2.0) | ||
| High school | 5,973 | 5,755 (96.4) | 218 (3.6) | 4,466 | 4,285 (96.0) | 181 (4.0) | ||
| College or above | 11,364 | 10,941 (96.3) | 423 (3.7) | 8,007 | 7,643 (95.5) | 364 (4.5) | ||
| Income (10,000 KRW/month) | 0.051 | <0.001 | ||||||
| <200 | 2,824 | 2,743 (97.1) | 82 (3.6) | 6,114 | 5,941 (97.2) | 173 (2.8) | ||
| 200–299 | 5,114 | 4,876 (95.3) | 238 (4.7) | 5,442 | 5,182 (95.2) | 260 (4.8) | ||
| 300–399 | 5,471 | 5,280 (96.5) | 191 (3.5) | 1,698 | 1,612 (94.9) | 86 (5.1) | ||
| ≥400 | 5,089 | 4,917 (96.6) | 171 (3.4) | 777 | 720 (92.7) | 57 (7.3) | ||
| Occupational type | 0.080 | 0.012 | ||||||
| White collar | 8,346 | 8,053 (96.5) | 293 (3.5) | 7,206 | 6,862 (95.2) | 344 (4.8) | ||
| Pink collar | 1,945 | 1,895 (97.4) | 50 (2.6) | 3,630 | 3,507 (96.6) | 123 (3.4) | ||
| Blue collar | 8,207 | 7,869 (95.9) | 339 (4.1) | 3,196 | 3,087 (96.6) | 109 (3.4) | ||
| Company size | 0.595 | <0.001 | ||||||
| <50 | 10,508 | 10,098 (96.1) | 410 (3.9) | 10,084 | 9,749 (96.7) | 334 (3.3) | ||
| 50–299 | 3,822 | 3,690 (96.6) | 131 (3.4) | 2,364 | 2,225 (94.1) | 139 (5.9) | ||
| ≥300 | 4,169 | 4,027 (96.6) | 141 (3.4) | 1,584 | 1,481 (93.5) | 102 (6.5) | ||
| Shift work | 0.944 | 0.437 | ||||||
| No | 16,329 | 15,725 (96.3) | 604 (3.7) | 12,898 | 12,375 (95.9) | 523 (4.1) | ||
| Yes | 2,170 | 2,092 (96.4) | 79 (3.6) | 1,133 | 1,081 (95.4) | 53 (4.6) | ||
| Working hours (hours/week) | <0.01 | <0.001 | ||||||
| <40 | 2,121 | 2,055 (96.9) | 66 (3.1) | 4,023 | 3,931 (97.7) | 92 (2.3) | ||
| 40–52 | 14,866 | 14,336 (96.4) | 530 (3.6) | 9,421 | 8,964 (95.1) | 456 (4.9) | ||
| >52 | 1,512 | 1,426 (94.3) | 87 (5.7) | 587 | 560 (95.4) | 27 (4.6) | ||
| Commute time (minutes/day) | 0.036 | <0.001 | ||||||
| ≤60 | 14,557 | 14,060 (96.6) | 496 (3.4) | 12,176 | 11,726 (96.3) | 451 (3.7) | ||
| 61–120 | 3,318 | 3,172 (95.6) | 146 (4.4) | 1,580 | 1,498 (94.8) | 82 (5.2) | ||
| ≥121 | 624 | 583 (93.5) | 40 (6.5) | 276 | 233 (84.3) | 43 (15.7) | ||
Table 4.
Adjusted predicted probability of presenteeism and absenteeism
| Baseline probability (%) | Long commute probability (%) | Absolute difference (%p) | |
|---|---|---|---|
| Male | |||
| Presenteeism | |||
| Crude | 9.08 | 14.31 | 5.23 |
| Model 1a | 9.21 | 12.33 | 3.12 |
| Model 2b | 9.17 | 12.84 | 3.67 |
| Absenteeism | |||
| Crude | 3.41 | 6.46 | 3.05 |
| Model 1a | 3.46 | 5.62 | 2.16 |
| Model 2b | 3.44 | 5.84 | 2.40 |
| Female | |||
| Presenteeism | |||
| Crude | 12.31 | 33.85 | 21.54 |
| Model 1a | 12.51 | 26.22 | 13.71 |
| Model 2b | 12.56 | 25.66 | 13.10 |
| Absenteeism | |||
| Crude | 3.70 | 15.67 | 11.97 |
| Model 1a | 3.80 | 11.04 | 7.24 |
| Model 2b | 3.84 | 10.30 | 6.46 |
Baseline probability: predicted probability in the ≤60 minutes commute group; Long commute probability: predicted probability in the ≥121 minutes commute group; Absolute difference: absolute difference between these two probabilities (percentage points).
aAdjusted for age, self-rated health status, education, and income (10,000 KRW/month);
bAdjusted for age, self-rated health status, education, income (10,000 KRW/month), occupational type, company size, shift work, and working hours (hours/week).
- 1. Barrington-Leigh C, Millard-Ball A. Global trends toward urban street-network sprawl. Proc Natl Acad Sci U S A 2020;117(4):1941–50.ArticlePubMedPMC
- 2. Organisation for Economic Co-operation and Development. LMF2.6: Time Spent Travelling to and from Work. Paris, France: OECD Family Database; 2016.
- 3. Statistics Korea. 2024 commuting workers’ mobility characteristics. https://mods.go.kr/board.es?mid=a10301010000&bid=246&act=view&list_no=434303&tag=&nPage=1. Updated 2024. Accessed June 7, 2026.
- 4. Jung J, Ko K, Park JB, Lee KJ, Cho YH, Jeong I. Association between commuting time and subjective well-being in relation to regional differences in Korea. J Korean Med Sci 2023;38(15):e118.ArticlePubMedPMCPDF
- 5. Lee S, Cho K, Jeon Y. Travel efficiency in urban space: the role of built environment in shaping excess travel distance across transport modes. Sci Rep 2025;15(1):33372.ArticlePubMedPMCPDF
- 6. Henning-Smith C, Kozhimannil K, Evenson A. Addressing Commuting as a Public Health Issue: Strategies Should Differ by Rurality. Minneapolis, MN: University of Minnesota Rural Health Research Center; 2018, 1–5.
- 7. Rivkin W, Gerpott FH, Unger D. There and back again: the roles of morning- and evening commute recovery experiences for daily resources across the commute-, work-, and home domain. Hum Relat 2025;78(3):312–48.ArticlePDF
- 8. Xiao H, Wu A, Kim J. Commuting and innovation: are closer inventors more productive? J Urban Econ 2021;121:103300.Article
- 9. Dokkedal-Silva V, Fernandes GL, Tufik S, Andersen ML. The links between commuting time and sleep quality: a trend in modern urban centers. J Clin Sleep Med 2022;18(12):2875–6.ArticlePubMedPMC
- 10. Lee DW, Yun JY, Lee N, Hong YC. Association between commuting time and depressive symptoms in 5th Korean Working Conditions Survey. J Transp Health 2024;34:101731.Article
- 11. Chen YH, Lin JJ, Yang CW, Tang HM, Jong GP, Yang TY. The effect of commuting time on burnout: the mediation effect of musculoskeletal pain. BMC Health Serv Res 2024;24(1):468.ArticlePubMedPMCPDF
- 12. Hoehner CM, Barlow CE, Allen P, Schootman M. Commuting distance, cardiorespiratory fitness, and metabolic risk. Am J Prev Med 2012;42(6):571–8.ArticlePubMedPMC
- 13. Van Ommeren JN, Gutierrez-i-Puigarnau E. Are workers with a long commute less productive? An empirical analysis of absenteeism. Reg Sci Urban Econ 2011;41(1):1–8.Article
- 14. Ma L, Liu Y, Sun X, Ye R. Impact of commuting time on self-reported work productivity: a quasi-longitudinal examination. Travel Behav Soc 2024;37:100837.Article
- 15. Cooper C, Dewe P. Well-being: absenteeism, presenteeism, costs and challenges. Occup Med (Lond) 2008;58(8):522–4.ArticlePubMed
- 16. Johns G. Presenteeism in the workplace: a review and research agenda. J Organ Behav 2010;31(4):519–42.ArticlePDF
- 17. Duchaine CS, Aube K, Gilbert-Ouimet M, Vezina M, Ndjaboue R, Massamba V, et al. Psychosocial stressors at work and the risk of sickness absence due to a diagnosed mental disorder: a systematic review and meta-analysis. JAMA Psychiatry 2020;77(8):842–51.ArticlePubMedPMC
- 18. Ma L, Ye R. Does daily commuting behavior matter to employee productivity? J Transp Geogr 2019;76:130–41.Article
- 19. Choi Y, Park J. The Korean Working Conditions Survey (KWCS): a review on the utilization of the survey database. J Korean Soc Occup Environ Hyg 2019;29(4):431–41.
- 20. Choi BY, Lee JH, Son SY, Ryoo SW, Min JY, Min KB. Association between commute time and loneliness: an analysis based on 2023 Seoul survey data. J Transp Health 2025;43:102059.Article
- 21. Gordeev VS, Maksymowych WP, Schachna L, Boonen A. Understanding presenteeism in patients with ankylosing spondylitis: contributing factors and association with sick leave. Arthritis Care Res (Hoboken) 2014;66(6):916–24.ArticlePubMed
- 22. Pfortner TK, Demirer I. To what extent do job insecurity, income satisfaction, and self-rated health mediate the association between low income and presenteeism in Germany?: a gendered analysis. Int Arch Occup Environ Health 2023;96(7):999–1008.ArticlePubMedPDF
- 23. Goto E, Ishikawa H, Okuhara T, Ueno H, Okada H, Fujino Y, et al. Presenteeism among workers: health-related factors, work-related factors and health literacy. Occup Med (Lond) 2020;70(8):564–9.ArticlePubMedPDF
- 24. Yi JS, Kim H. Factors related to presenteeism among South Korean workers exposed to workplace psychological adverse social behavior. Int J Environ Res Public Health 2020;17(10):3472.ArticlePubMedPMC
- 25. Kim SH, Jang EC, Kwon SC, Lee IH, Yun J, Jung UC, et al. Work-life balance and effort-reward imbalance, and their interaction, associated with presenteeism among Korean wage workers: based on 6th Korean Working Conditions Survey. Ann Occup Environ Med 2026;38:e1.ArticlePubMedPMCPDF
- 26. Goetzel RZ, Long SR, Ozminkowski RJ, Hawkins K, Wang S, Lynch W. Health, absence, disability, and presenteeism cost estimates of certain physical and mental health conditions affecting U.S. employers. J Occup Environ Med 2004;46(4):398–412.ArticlePubMed
- 27. Brouwer W, Verbooy K, Hoefman R, van Exel J. Production losses due to absenteeism and presenteeism: the influence of compensation mechanisms and multiplier effects. Pharmacoeconomics 2023;41(9):1103–15.ArticlePubMedPMCPDF
- 28. Goerke L, Lorenz O. Commuting and Sickness Absence. IAAEU Discussion Paper Series in Economics. Trier, Germany: Institute for Labour Law and Industrial Relations in the European Union; 2017.
- 29. Wang Z, Wu Q, Guo M. Association between commute duration and sickness absence in the context of China: mechanism and heterogeneous effects. Front Public Health 2021;9:611162.ArticlePubMedPMC
- 30. Gerpott FH, Rivkin W, Unger D. Stop and go, where is my flow? How and when daily aversive morning commutes are negatively related to employees' motivational states and behavior at work. J Appl Psychol 2022;107(2):169–92.ArticlePubMed
- 31. Kunn-Nelen A. Does commuting affect health? Health Econ 2016;25(8):984–1004.ArticlePubMed
- 32. Meijman TF, Mulder G. Psychological aspects of workload. In: Drenth PJ, Thierry H, de Wolff CJ, editors. Handbook of Work and Organizational Psychology. Hove, UK: Psychology Press; 2013, 5–33.
- 33. Lee HC, Yang EH, Shin S, Moon SH, Song N, Ryoo JH. Correlation of commute time with the risk of subjective mental health problems: 6th Korean Working Conditions Survey (KWCS). Ann Occup Environ Med 2023;35:e9.ArticlePubMedPMCPDF
- 34. de Oliveira C, Saka M, Bone L, Jacobs R. The role of mental health on workplace productivity: a critical review of the literature. Appl Health Econ Health Policy 2023;21(2):167–93.ArticlePubMedPDF
- 35. Shrestha RM, Inoue Y, Miyake H, Yoshihara S, Miyamoto T, Okazaki H, et al. Is work-family conflict associated with health-related absenteeism and presenteeism among Japanese workers? Occup Med (Lond) 2026;76:263–70.ArticlePubMed
- 36. Lee IH, Lee JB. Effects of commuting time of wage workers on work-family conflict as a living environment factor using the 7th Working Environment Survey. J Korean Soc Living Environ Syst 2025;32(6):769–77.Article
- 37. Kwon MJ. Occupational health inequalities by issues on gender and social class in labor market: absenteeism and presenteeism across 26 OECD countries. Front Public Health 2020;8:84.ArticlePubMedPMC
- 38. Bae YH. Exploratory analysis of related factors with absenteeism and presenteeism on workers: using the Fourth Korea Working Condition Survey. Int J Environ Res Public Health 2021;18(21):11214.ArticlePubMedPMC
- 39. Roberts J, Hodgson R, Dolan P. "It's driving her mad": gender differences in the effects of commuting on psychological health. J Health Econ 2011;30(5):1064–76.ArticlePubMed
- 40. Doyal L. Sex, gender, and health: the need for a new approach. BMJ 2001;323(7320):1061–3.ArticlePubMedPMC
- 41. Gustafsson Senden M, Schenck-Gustafsson K, Fridner A. Gender differences in reasons for sickness presenteeism: a study among GPs in a Swedish health care organization. Ann Occup Environ Med 2016;28:50.ArticlePubMedPMC
- 42. Laaksonen M, Mastekaasa A, Martikainen P, Rahkonen O, Piha K, Lahelma E. Gender differences in sickness absence: the contribution of occupation and workplace. Scand J Work Environ Health 2010;36(5):394–403.ArticlePubMed
- 43. Dynan KE, Kirkegaard JF, Stansbury A. Why Gender Disparities Persist in South Korea’s Labor Market. Peterson Institute for International Economics Working Paper 22-11. Washington, DC: Peterson Institute for International Economics; 2022.
- 44. Arvind A, Sreelekshmi S, Dubey N. Genetic, epigenetic, and hormonal regulation of stress phenotypes in major depressive disorder: from maladaptation to resilience. Cell Mol Neurobiol 2025;45(1):29.ArticlePubMedPMCPDF
- 45. Lee W, Kang YJ, Kim T, Choi J, Kang MY. The impact of working hours on cardiovascular diseases and moderating effects of sex and type of work: results from a longitudinal analysis of the Korean working population. J Occup Environ Med 2019;61(6):e247–52.ArticlePubMed
- 46. Shifrin NV, Michel JS. Flexible work arrangements and employee health: a meta-analytic review. Work Stress 2022;36(1):60–85.Article
- 47. Statistics Korea. Population and Housing Census. Daejeon, Korea: Statistics Korea; 2022.
- 48. Hall CE, Davidson L, Brooks SK, Greenberg N, Weston D. The relationship between homeworking during COVID-19 and both, mental health, and productivity: a systematic review. BMC Psychol 2023;11(1):188.ArticlePubMedPMCPDF
- 49. Ospina MB, Dennett L, Waye A, Jacobs P, Thompson AH. A systematic review of measurement properties of instruments assessing presenteeism. Am J Manag Care 2015;21(2):e171–85.PubMed
- 50. Johns G, Miraglia M. The reliability, validity, and accuracy of self-reported absenteeism from work: a meta-analysis. J Occup Health Psychol 2015;20(1):1–14.ArticlePubMed
REFERENCES
Figure & Data
REFERENCES
Citations
Citations to this article as recorded by 
 Cite
Cite XML Download
- Figure
-
- Related articles
-
- Association between urinary bisphenol levels and metabolic syndrome in Korean adults: a cross-sectional study using the fourth Korean National Environmental Health Survey
- Association between workplace cooperation and depressive symptoms differs according to employment type: the 7th Korean Working Conditions Survey
- Association between working ≥10 hours per day and satisfaction with work environment among wage workers in Korea: a cross-sectional study using data from the 7th Korean Working Conditions Survey
- Association between sudden work recall and psychological health issues: a cross-sectional analysis of the 6th Korean Working Conditions Survey
- Association between multiple jobs and physical and psychological symptoms among the Korean working population
The association between commute time and both presenteeism and absenteeism: a cross-sectional analysis of the 6th Korean Working Conditions Survey
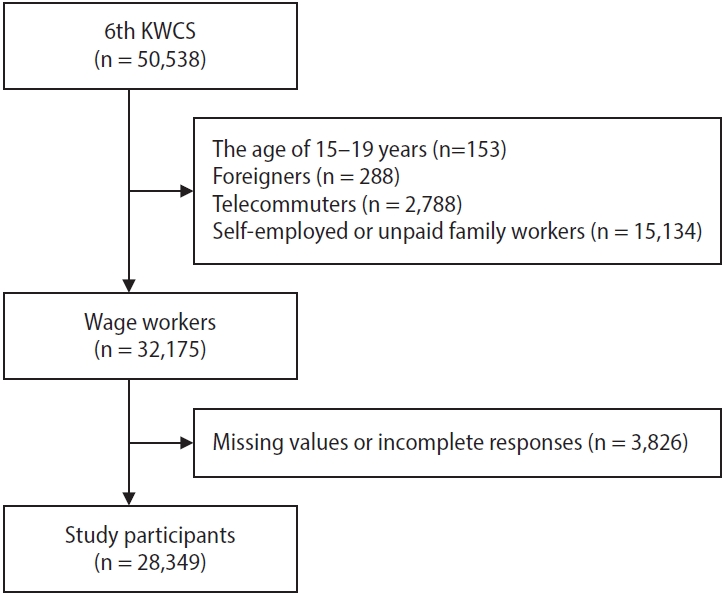
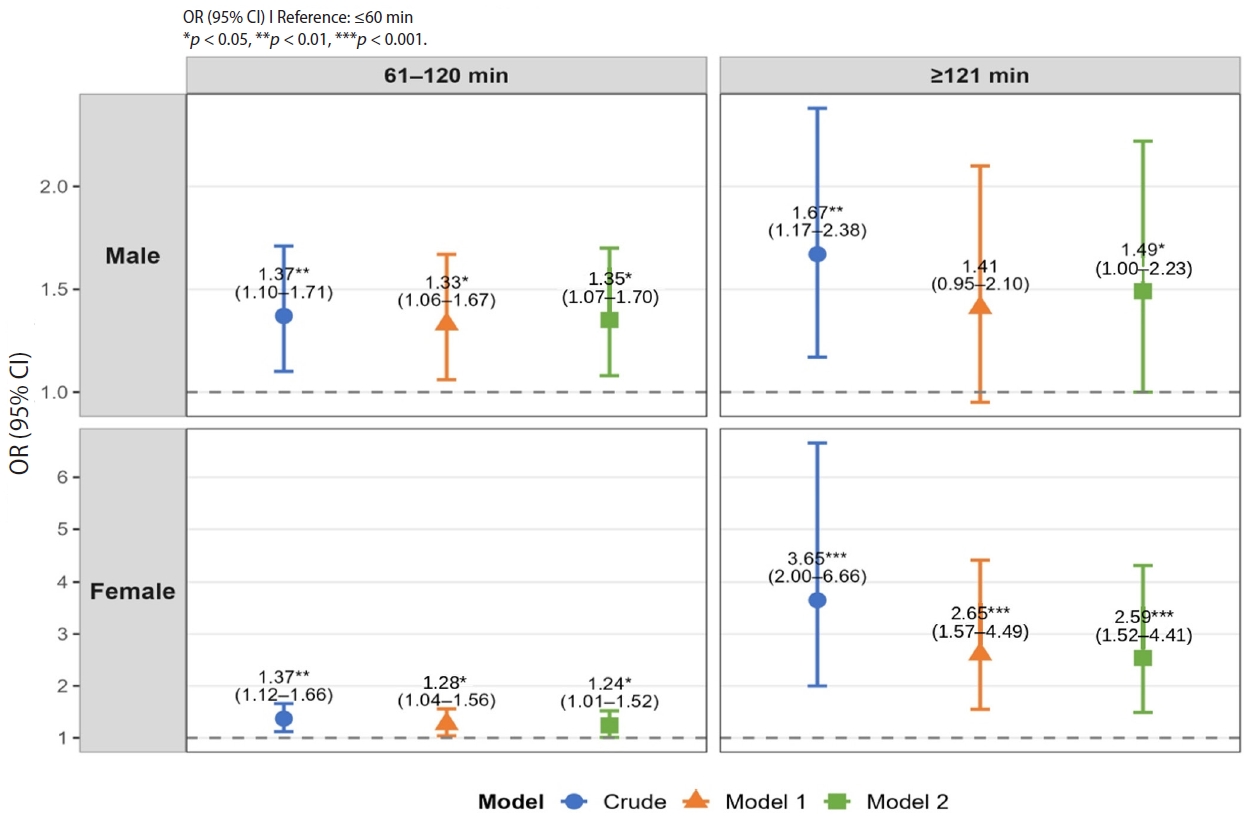
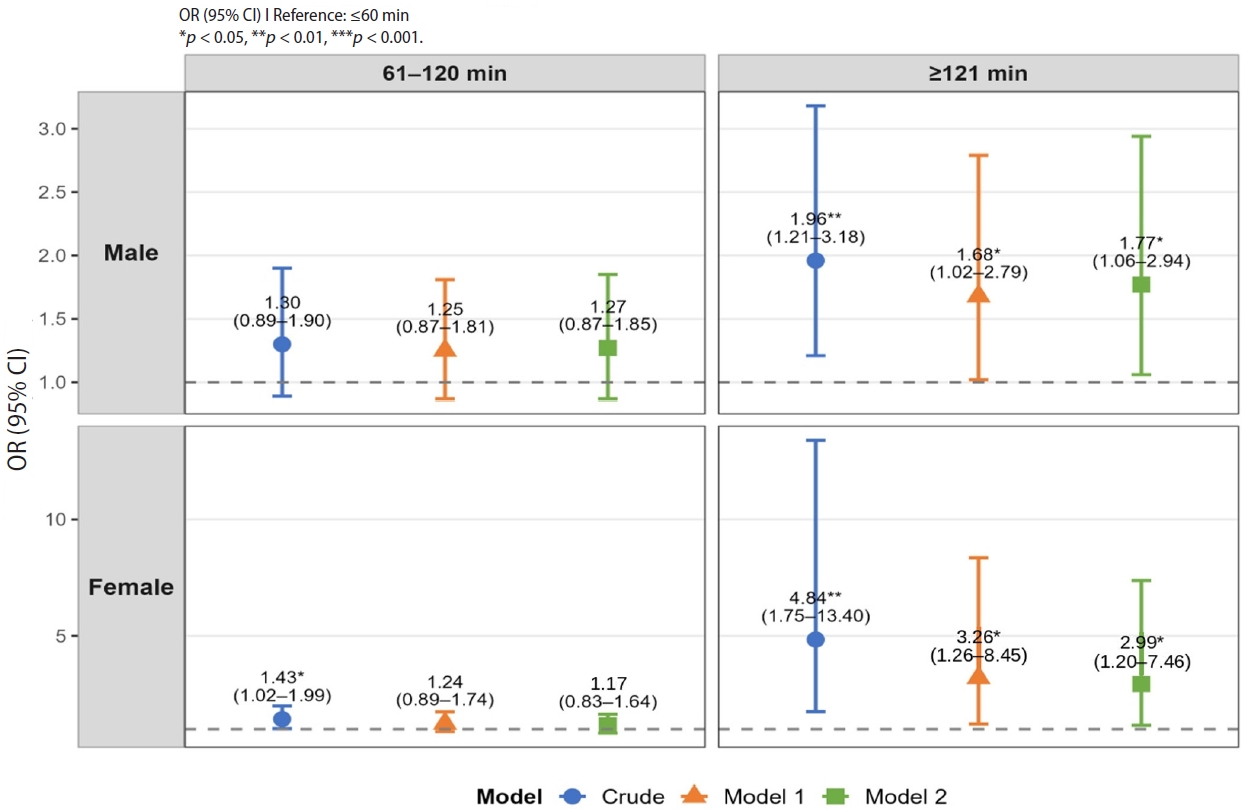
Fig. 1. Flow chart of the selection of study subjects. KWCS: Korean Working Conditions Survey.
Fig. 2. ORs of presenteeism according to commute time. Model 1: adjusted for age, self-rated health status, education, and income (10,000 KRW/month). Model 2: adjusted for age, self-rated health status, education, income (10,000 KRW/month), occupational type, company size, shift work, and working hours (hours/week). OR: odds ratio; CI: confidence interval.
Fig. 3. ORs of absenteeism according to commute time. Model 1: adjusted for age, self-rated health status, education, and income (10,000 KRW/month). Model 2: adjusted for age, self-rated health status, education, income (10,000 KRW/month), occupational type, company size, shift work, and working hours (hours/week). OR: odds ratio; CI: confidence interval.
Fig. 1.
Fig. 2.
Fig. 3.
The association between commute time and both presenteeism and absenteeism: a cross-sectional analysis of the 6th Korean Working Conditions Survey
| Characteristic | No. (%) (n = 28,349) | No. (%) (n = 32,530) |
|---|---|---|
| Sex | ||
| Male | 13,311 (47.0) | 18,499 (56.9) |
| Female | 15,038 (53.0) | 14,032 (43.1) |
| Age (years) | ||
| 20–29 | 3,706 (13.1) | 5,409 (16.6) |
| 30–39 | 6,176 (21.8) | 7,379 (22.7) |
| 40–49 | 6,894 (24.3) | 8,045 (24.7) |
| 50–59 | 6,551 (23.1) | 7,134 (21.9) |
| ≥60 | 5,022 (17.7) | 4,563 (14.0) |
| Self-rated health status | ||
| Good | 20,037 (70.7) | 23,554 (72.4) |
| Bad | 8,312 (29.3) | 8,977 (27.6) |
| Education | ||
| Middle school or below | 3,138 (11.1) | 2,720 (8.4) |
| High school | 9,684 (34.2) | 10,439 (32.1) |
| College or above | 15,527 (54.8) | 19,371 (59.5) |
| Income (10,000 KRW/month) | ||
| <200 | 8,919 (31.5) | 8,938 (27.5) |
| 200–299 | 9,675 (34.1) | 10,556 (32.5) |
| 300–399 | 5,750 (20.3) | 7,170 (22.0) |
| ≥400 | 4,005 (14.1) | 5,866 (18.0) |
| Occupational type | ||
| White collar | 12,613 (44.5) | 15,552 (50.8) |
| Pink collar | 6,590 (23.2) | 5,575 (16.6) |
| Blue collar | 9,146 (32.3) | 11,404 (32.6) |
| Working hours (hours/week) | ||
| <40 | 6,021 (21.2) | 6,144 (18.9) |
| 40–52 | 20,388 (71.9) | 24,287 (74.7) |
| >52 | 1,940 (6.8) | 2,099 (6.5) |
| Company size | ||
| <50 | 19,271 (68.0) | 20,592 (63.3) |
| 50–299 | 4,789 (16.9) | 6,186 (19.0) |
| ≥300 | 4,289 (15.1) | 5,753 (17.7) |
| Shift work | ||
| No | 25,612 (90.3) | 29,227 (89.8) |
| Yes | 2,737 (9.7) | 3,304 (10.2) |
| Commute time (minutes/day) | ||
| ≤60 | 24,253 (85.6) | 26,733 (82.1) |
| 61–120 | 3,523 (12.4) | 4,898 (15.1) |
| ≥121 | 573 (2.0) | 900 (2.8) |
| Presenteeism | ||
| No | 25,170 (88.8) | 28,873 (88.8) |
| Yes | 3,179 (11.2) | 3,657 (11.2) |
| Absenteeism | ||
| No | 27,262 (96.2) | 31,272 (96.1) |
| Yes | 1,087 (3.8) | 1,258 (3.9) |
| Variable | Male | Female | ||||||
|---|---|---|---|---|---|---|---|---|
| Total | No presenteeism | Presenteeism | p-value |
Total | No presenteeism | Presenteeism | p-value |
|
| Age (years) | <0.001 | 0.358 | ||||||
| 20–29 | 2,563 | 2,423 (94.5) | 140 (5.5) | 2,846 | 2,512 (88.3) | 333 (11.7) | ||
| 30–39 | 4,565 | 4,116 (90.2) | 449 (9.8) | 2,814 | 2,427 (86.2) | 387 (13.8) | ||
| 40–49 | 4,839 | 4,269 (88.2) | 571 (11.8) | 3,206 | 2,767 (86.3) | 438 (13.7) | ||
| 50–59 | 4,024 | 3,590 (89.2) | 434 (10.8) | 3,110 | 2,676 (86.1) | 433 (13.9) | ||
| ≥60 | 2,507 | 2,289 (91.3) | 218 (8.7) | 2,056 | 1,803 (87.7) | 253 (12.3) | ||
| Self-rated health status | <0.001 | <0.001 | ||||||
| Good | 13,594 | 12,764 (93.9) | 830 (6.1) | 9,960 | 9,111 (91.5) | 849 (8.5) | ||
| Bad | 4,905 | 3,923 (80.0) | 981 (20.0) | 4,072 | 3,075 (75.5) | 997 (24.5) | ||
| Education | 0.227 | 0.123 | ||||||
| Middle school or below | 1,162 | 1,038 (89.4) | 123 (10.6) | 1,559 | 1,371 (88.0) | 188 (12.0) | ||
| High school | 5,973 | 5,347 (89.5) | 626 (10.5) | 4,466 | 3,916 (87.7) | 550 (12.3) | ||
| College or above | 11,364 | 10,302 (90.7) | 1,062 (9.3) | 8,007 | 6,899 (86.2) | 1,108 (13.8) | ||
| Income (10,000 KRW/month) | 0.078 | <0.001 | ||||||
| <200 | 2,824 | 2,607 (92.3) | 217 (7.7) | 6,114 | 5,443 (89.0) | 671 (11.0) | ||
| 200–299 | 5,114 | 4,614 (90.2) | 501 (9.8) | 5,442 | 4,640 (85.3) | 802 (14.7) | ||
| 300–399 | 5,471 | 4,916 (89.8) | 555 (10.2) | 1,698 | 1,455 (85.7) | 243 (14.3) | ||
| ≥400 | 5,089 | 4,551 (89.4) | 538 (10.6) | 777 | 648 (83.4) | 129 (16.6) | ||
| Occupational type | <0.01 | 0.018 | ||||||
| White collar | 8,346 | 7,583 (90.9) | 763 (9.1) | 7,206 | 6,177 (85.7) | 1,028 (14.3) | ||
| Pink collar | 1,945 | 1,816 (93.4) | 129 (6.6) | 3,630 | 3,201 (88.2) | 429 (11.8) | ||
| Blue collar | 8,207 | 7,288 (88.8) | 919 (11.2) | 3,196 | 2,807 (87.8) | 389 (12.2) | ||
| Company size | 0.154 | <0.001 | ||||||
| <50 | 10,508 | 9,540 (90.8) | 967 (9.2) | 10,084 | 8,865 (87.9) | 1,219 (12.1) | ||
| 50–299 | 3,822 | 3,404 (89.1) | 417 (10.9) | 2,364 | 1,993 (84.3) | 371 (15.7) | ||
| ≥300 | 4,169 | 3,743 (89.8) | 426 (10.2) | 1,584 | 1,328 (83.8) | 256 (16.2) | ||
| Shift work | <0.01 | <0.001 | ||||||
| No | 16,329 | 14,795 (90.6) | 1,533 (9.4) | 12,898 | 11,288 (87.5) | 1,610 (12.5) | ||
| Yes | 2,170 | 1,892 (87.2) | 278 (12.8) | 1,133 | 897 (79.2) | 236 (20.8) | ||
| Working hours (hours/week) | <0.001 | <0.001 | ||||||
| <40 | 2,121 | 1,975 (93.1) | 146 (6.9) | 4,023 | 3,637 (90.4) | 386 (9.6) | ||
| 40–52 | 14,866 | 13,442 (90.4) | 1,424 (9.6) | 9,421 | 8,068 (85.6) | 1,354 (14.4) | ||
| >52 | 1,512 | 1,271 (84.1) | 241 (15.9) | 587 | 481 (81.9) | 106 (18.1) | ||
| Commute time (minutes/day) | <0.001 | <0.001 | ||||||
| ≤60 | 14,557 | 13,235 (90.9) | 1,322 (9.1) | 12,176 | 10,678 (87.7) | 1,499 (12.3) | ||
| 61–120 | 3,318 | 2,919 (88.0) | 400 (12.0) | 1,580 | 1,326 (83.9) | 254 (16.1) | ||
| ≥121 | 624 | 535 (85.7) | 89 (14.3) | 276 | 183 (66.2) | 93 (33.8) | ||
| Variable | Male | Female | ||||||
|---|---|---|---|---|---|---|---|---|
| Total | No absenteeism | Absenteeism | p-value |
Total | No absenteeism | Absenteeism | p-value |
|
| Age (years) | 0.109 | 0.246 | ||||||
| 20–29 | 2,563 | 2,470 (96.3) | 94 (3.7) | 2,846 | 2,735 (96.1) | 111 (3.9) | ||
| 30–39 | 4,565 | 4,384 (96.0) | 181 (4.0) | 2,814 | 2,676 (95.1) | 138 (4.9) | ||
| 40–49 | 4,839 | 4,621 (95.5) | 218 (4.5) | 3,206 | 3,070 (95.8) | 136 (4.2) | ||
| 50–59 | 4,024 | 3,894 (96.8) | 129 (3.2) | 3,110 | 2,978 (95.7) | 132 (4.3) | ||
| ≥60 | 2,507 | 2,447 (97.6) | 60 (2.4) | 2,056 | 1,997 (97.1) | 59 (2.9) | ||
| Self-rated health status | <0.001 | <0.001 | ||||||
| Good | 13,594 | 13,283 (97.7) | 311 (2.3) | 9,960 | 9,692 (97.3) | 268 (2.7) | ||
| Bad | 4,905 | 4,533 (92.4) | 372 (7.6) | 4,072 | 3,764 (92.4) | 308 (7.6) | ||
| Education | 0.976 | <0.01 | ||||||
| Middle school or below | 1,162 | 1,120 (96.4) | 42 (3.6) | 1,559 | 1,528 (98.0) | 31 (2.0) | ||
| High school | 5,973 | 5,755 (96.4) | 218 (3.6) | 4,466 | 4,285 (96.0) | 181 (4.0) | ||
| College or above | 11,364 | 10,941 (96.3) | 423 (3.7) | 8,007 | 7,643 (95.5) | 364 (4.5) | ||
| Income (10,000 KRW/month) | 0.051 | <0.001 | ||||||
| <200 | 2,824 | 2,743 (97.1) | 82 (3.6) | 6,114 | 5,941 (97.2) | 173 (2.8) | ||
| 200–299 | 5,114 | 4,876 (95.3) | 238 (4.7) | 5,442 | 5,182 (95.2) | 260 (4.8) | ||
| 300–399 | 5,471 | 5,280 (96.5) | 191 (3.5) | 1,698 | 1,612 (94.9) | 86 (5.1) | ||
| ≥400 | 5,089 | 4,917 (96.6) | 171 (3.4) | 777 | 720 (92.7) | 57 (7.3) | ||
| Occupational type | 0.080 | 0.012 | ||||||
| White collar | 8,346 | 8,053 (96.5) | 293 (3.5) | 7,206 | 6,862 (95.2) | 344 (4.8) | ||
| Pink collar | 1,945 | 1,895 (97.4) | 50 (2.6) | 3,630 | 3,507 (96.6) | 123 (3.4) | ||
| Blue collar | 8,207 | 7,869 (95.9) | 339 (4.1) | 3,196 | 3,087 (96.6) | 109 (3.4) | ||
| Company size | 0.595 | <0.001 | ||||||
| <50 | 10,508 | 10,098 (96.1) | 410 (3.9) | 10,084 | 9,749 (96.7) | 334 (3.3) | ||
| 50–299 | 3,822 | 3,690 (96.6) | 131 (3.4) | 2,364 | 2,225 (94.1) | 139 (5.9) | ||
| ≥300 | 4,169 | 4,027 (96.6) | 141 (3.4) | 1,584 | 1,481 (93.5) | 102 (6.5) | ||
| Shift work | 0.944 | 0.437 | ||||||
| No | 16,329 | 15,725 (96.3) | 604 (3.7) | 12,898 | 12,375 (95.9) | 523 (4.1) | ||
| Yes | 2,170 | 2,092 (96.4) | 79 (3.6) | 1,133 | 1,081 (95.4) | 53 (4.6) | ||
| Working hours (hours/week) | <0.01 | <0.001 | ||||||
| <40 | 2,121 | 2,055 (96.9) | 66 (3.1) | 4,023 | 3,931 (97.7) | 92 (2.3) | ||
| 40–52 | 14,866 | 14,336 (96.4) | 530 (3.6) | 9,421 | 8,964 (95.1) | 456 (4.9) | ||
| >52 | 1,512 | 1,426 (94.3) | 87 (5.7) | 587 | 560 (95.4) | 27 (4.6) | ||
| Commute time (minutes/day) | 0.036 | <0.001 | ||||||
| ≤60 | 14,557 | 14,060 (96.6) | 496 (3.4) | 12,176 | 11,726 (96.3) | 451 (3.7) | ||
| 61–120 | 3,318 | 3,172 (95.6) | 146 (4.4) | 1,580 | 1,498 (94.8) | 82 (5.2) | ||
| ≥121 | 624 | 583 (93.5) | 40 (6.5) | 276 | 233 (84.3) | 43 (15.7) | ||
| Baseline probability (%) | Long commute probability (%) | Absolute difference (%p) | |
|---|---|---|---|
| Male | |||
| Presenteeism | |||
| Crude | 9.08 | 14.31 | 5.23 |
| Model 1 |
9.21 | 12.33 | 3.12 |
| Model 2 |
9.17 | 12.84 | 3.67 |
| Absenteeism | |||
| Crude | 3.41 | 6.46 | 3.05 |
| Model 1 |
3.46 | 5.62 | 2.16 |
| Model 2 |
3.44 | 5.84 | 2.40 |
| Female | |||
| Presenteeism | |||
| Crude | 12.31 | 33.85 | 21.54 |
| Model 1 |
12.51 | 26.22 | 13.71 |
| Model 2 |
12.56 | 25.66 | 13.10 |
| Absenteeism | |||
| Crude | 3.70 | 15.67 | 11.97 |
| Model 1 |
3.80 | 11.04 | 7.24 |
| Model 2 |
3.84 | 10.30 | 6.46 |
Table 1. General and occupational characteristics of the study population
Values are presented as numbers (%). Numbers reflect weighted frequencies rounded to the nearest whole number.
Table 2. General and occupational characteristics of the participants according to presenteeism
Values are presented as numbers (%). All numbers reflect weighted frequencies rounded to the nearest whole number. χ2 test for categorical variables.
Table 3. General and occupational characteristics of the participants according to absenteeism
Values are presented as numbers (%). All numbers reflect weighted frequencies rounded to the nearest whole number. χ2 test for categorical variables.
Table 4. Adjusted predicted probability of presenteeism and absenteeism
Baseline probability: predicted probability in the ≤60 minutes commute group; Long commute probability: predicted probability in the ≥121 minutes commute group; Absolute difference: absolute difference between these two probabilities (percentage points). Adjusted for age, self-rated health status, education, and income (10,000 KRW/month); Adjusted for age, self-rated health status, education, income (10,000 KRW/month), occupational type, company size, shift work, and working hours (hours/week).


